

Daniel Tabin
@DanTabin • 2,484 subscribers
DNA and History fan
Videos


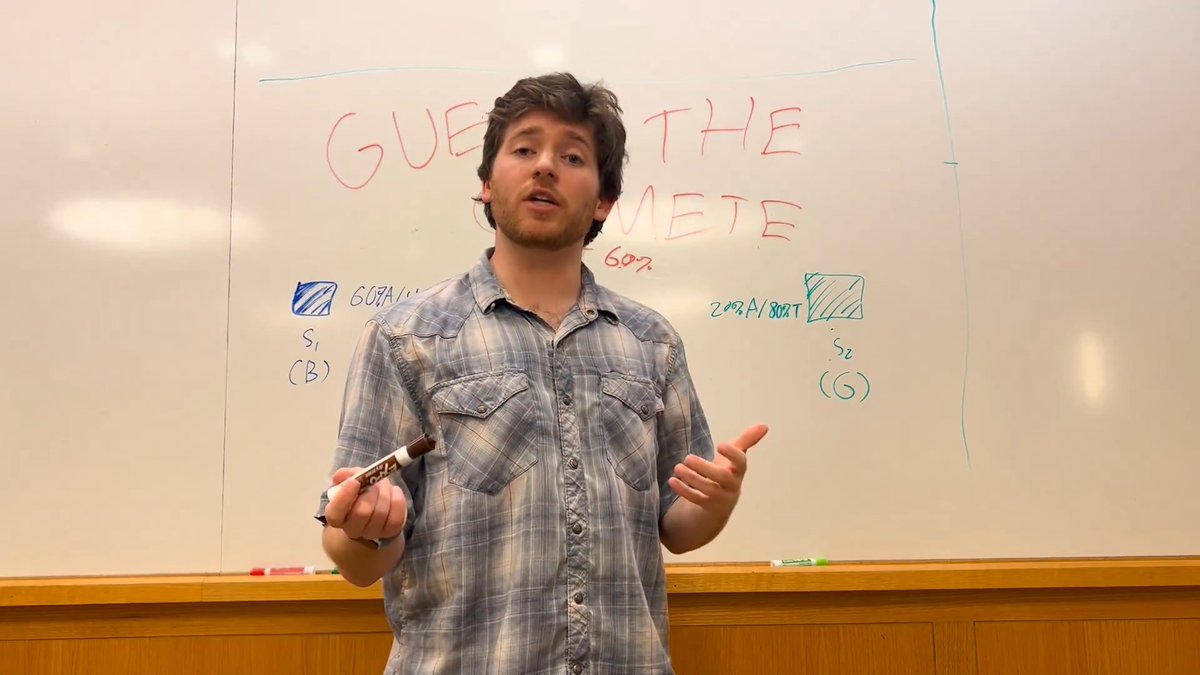
FST tells us that at most 15% of the information about someone's genome is explained by population structure, so how do PCA's distinguish populations with FST << 0.15? What is the relationship between FST and "variance explained" in PCA? Both answer and more in popgen video #8
Daniel Tabin18,584 次观看 • 2 个月前

How does one tell if some population A is closer to population B or C? The f4-statistic has you covered! In the 9th part of my popgen and aDNA methods series, we cover the basic intuition behind an f4-statistic and how it can be used to learn about relatedness and history.
Daniel Tabin16,802 次观看 • 2 个月前


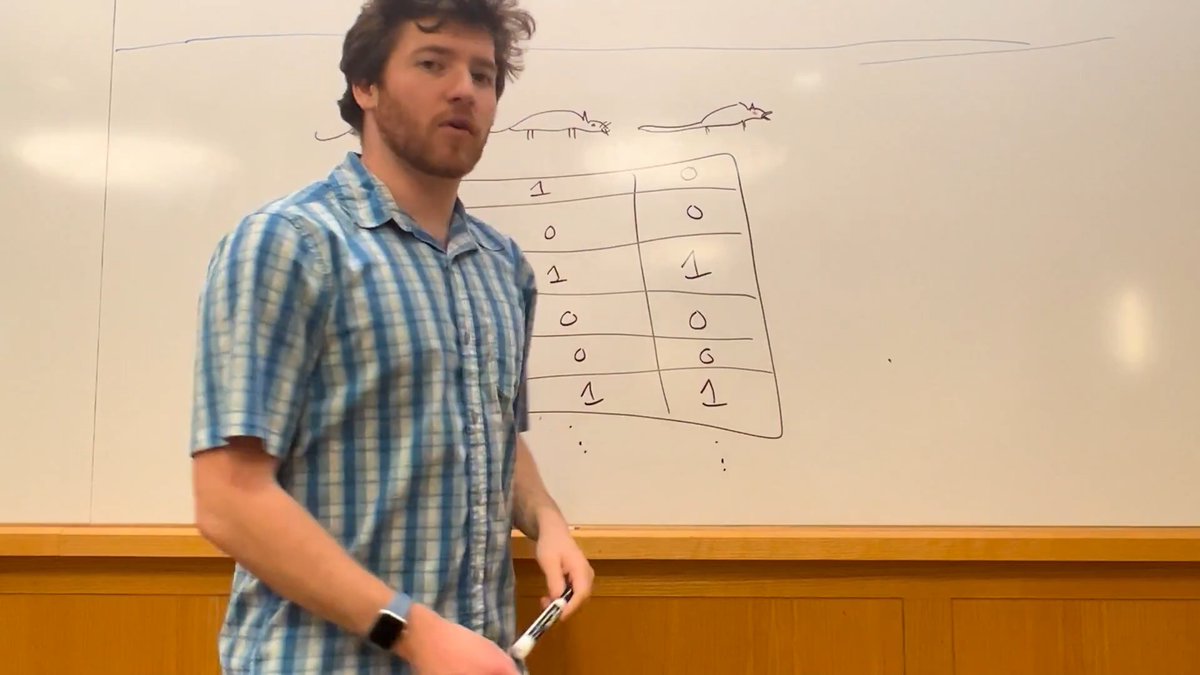
Genetic data is often on the order of 1-million-Dimensional. How on earth does one visualize this? PCA! In my sixth popgen / ancient DNA video, I give a (very) high level intuition for what PCAs are doing and how we can use them to reduce them dimensions of genetic data
Daniel Tabin17,156 次观看 • 3 个月前


Part 4 in my population genetics video continuing on FST. In this video I give examples of why you should think of FST as differentiability, not distance, then relate it to heterozygosity and variance before giving an intuition of what an FST of, for example, 0.03 means
Daniel Tabin11,780 次观看 • 3 个月前
没有更多内容可加载