
Elastic
@elastic • 65,671 subscribers
Where developers learn, build, and share. Your source for hands-on demos, cheat sheets, explainers and more.
Videos

Building a dashboard mid-investigation means losing the thread you were pulling. Open the editor, pick indices, configure panels, wire up ES|QL queries. That's ten minutes of context switching before you've answered a single question. Kibana skips that now. • Describe what you need in plain language. • The agent explores your indices, generates ES|QL, picks chart types, and lays out the panels. Everything stays in your conversation until you save it. Then it becomes a first-class Kibana object your team can open and edit. Already viewing one? The agent attaches automatically. Ask why a metric spiked, add a comparison panel, break it down by region: all inline. Available as a technical preview in Elastic 9.4
Elastic10,146,231 görüntüleme • 5 ay önce

The hard parts of hybrid retrieval, already done. Elasticsearch Vector Database is a new serverless offering where expert-level tuning is the default: - bfloat16 storage: half the disk footprint before quantization even starts - BBQ: up to 32x vector compression, 95% less memory - Auto-calibration re-tunes quantization on every merge as your data drifts - Filtered vector search at up to 8x higher throughput than OpenSearch - Jina AI embeddings and reranking on managed GPU inference, or bring your own models You bring documents and queries. We handle the embeddings, tuning, and infrastructure. Full breakdown, including the semantic_text quickstart and what ships in vectorDB index mode:
Elastic1,363,087 görüntüleme • 1 ay önce
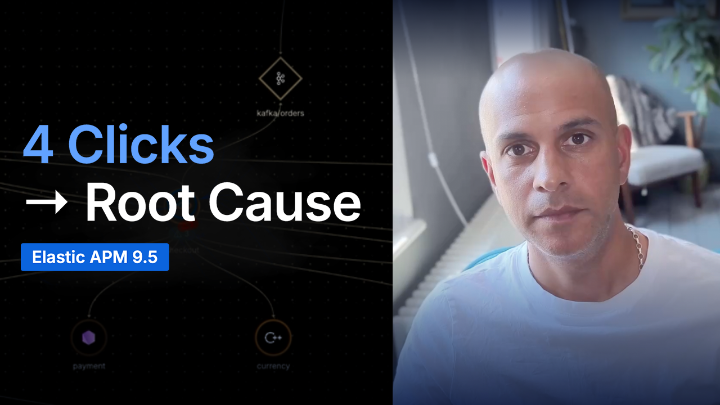
A RED metric alert fires on checkout. Is a dependency responsible? Until now, answering that meant leaving the alert and opening the service map elsewhere in Kibana. In Elastic APM 9.5, the map is on the alert detail page when you land. Open the service fly-out: RED metrics, anomaly status, transaction breakdown per service. One click to Traces in Discover from any connection. We traced a checkout failure to a bad shipping deployment. 4 steps, never left the alert. Blog has the full walkthrough and feature list:
Elastic1,200,796 görüntüleme • 2 ay önce

Introducing the Elastic nightshift AI SRE – your always-on SRE coworker. •Investigates like an SRE, ruling out dead ends and showing you how it got there • Uses complete context from all your telemetry, not just what you could afford to keep • Finds unknown issues your alert rules don't cover • Recommends a fix and the evidence behind it • Works from the Kibana UI, a terminal, or an agent of your choice Now in Private Preview. Free on Serverless during the promotional period.
Elastic210,242 görüntüleme • 20 gün önce

Daha fazla içerik yok.