

Elastic
@elastic • 65,654 subscribers
Where developers learn, build, and share. Your source for hands-on demos, cheat sheets, explainers and more.
Videos
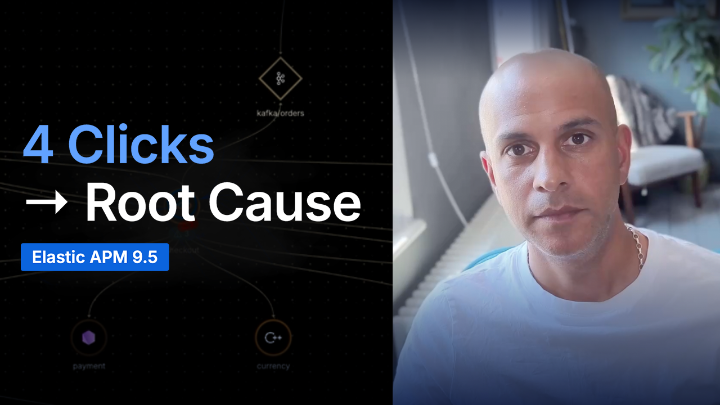
A RED metric alert fires on checkout. Is a dependency responsible? Until now, answering that meant leaving the alert and opening the service map elsewhere in Kibana. In Elastic APM 9.5, the map is on the alert detail page when you land. Open the service fly-out: RED metrics, anomaly status, transaction breakdown per service. One click to Traces in Discover from any connection. We traced a checkout failure to a bad shipping deployment. 4 steps, never left the alert. Blog has the full walkthrough and feature list:
Elastic856,268 次观看 • 9 天前

Building a dashboard mid-investigation means losing the thread you were pulling. Open the editor, pick indices, configure panels, wire up ES|QL queries. That's ten minutes of context switching before you've answered a single question. Kibana skips that now. • Describe what you need in plain language. • The agent explores your indices, generates ES|QL, picks chart types, and lays out the panels. Everything stays in your conversation until you save it. Then it becomes a first-class Kibana object your team can open and edit. Already viewing one? The agent attaches automatically. Ask why a metric spiked, add a comparison panel, break it down by region: all inline. Available as a technical preview in Elastic 9.4
Elastic10,146,231 次观看 • 2 个月前

没有更多内容可加载