

Mike Hoerger, PhD MSCR MBA
@michael_hoerger • 41,896 subscribers
Expert in weighing medical evidence, cancer, COVID forecasting & mitigation, health disparities, financial analytics. 120 publications. PhD program director.
Shorts

Videos

🚨BREAKING 🦠 On Friday, the US CDC arbitrarily shifted higher COVlD levels into lower categories depicted with cooler colors. Much of what was Very High is now "High." What was High is now "Moderate" or "Low." Low is "Very Low." 🔹2 states/territories artificially shifted from High to Moderate (MS, GU) 🔹5 shifted from Moderate to Low (CA, TX, AK, WA, NV) 🔹4 shifted from Low to Very Low (AZ, AR, LA, NC) During intense surges, states will rarely get classified as Very High anymore. Presently, transmission is rising across the US, with a 75% chance of a wave, but states will be depicted in blue (Very Low) much longer, making communities less prepared. #Bluewashing Normally, when the CDC makes a methodology change, they flag it prominently on each of their COVlD monitoring pages. This time, there was no alert and no explanation. Major changes were confined to COVlD, not Influenza A, and not RSV. The questionable change was made in the middle of rising transmission across most of the country; 15 states already have COVlD outbreaks, and others may soon join the ranks. These are serious ethics concerns that warrant investigative journalism. These issues are aggravated by delayed reporting at High/Very High monitoring sites. Sites with 1-week reporting delays get excluded when the CDC calculates current levels. For example, only 16% of the sites online in Texas (3 of 19) report High/Very High levels, but 90% of those with a 1-week reporting delay (18 of 20) have High/Very High levels, leading the state to get classified as "Low" when really High. These issues snowball and can easily push a state down 1-2 categories when experiencing significant COVlD outbreaks. The good news is that the individual wastewater monitoring site data are still valid. The bad news is that the CDC maps and level descriptions will now mislead the casual user. Think: "Good data, bad use of data." At PMC, we told you that if there was any funny business at the CDC, we would warn you right away. We diagnosed the issue immediately and will still report accurate COVlD information. Expect further national news coverage this week. Journalists are welcome to reach out.
Mike Hoerger, PhD MSCR MBA451,496 Aufrufe • vor 2 Monaten

COVlD is surging in Texas, leading to school closures and rising Emergency Room visits, disproportionately among babies. We became concerned about the possible surge 3 months ago today, and Texas was the impetus for our early-release of the PMC county-level map.
Mike Hoerger, PhD MSCR MBA146,393 Aufrufe • vor 2 Monaten


"What's that mask?" It's a Moldex N95, among the most breathable respirators b/c it's pleated. Increased surface area = easier airflow. 5K Update (6 days to go): We're at $3,720 in donations to cancer research. Thank you! I will be wearing 75 N95s, and counting! (see pinned)
Mike Hoerger, PhD MSCR MBA19,810 Aufrufe • vor 14 Tagen

Hawai'i is in the midst of a large COVlD outbreak. Levels on the Big Island are estimated at approximately double that of the national peak of the largest COVlD surge (BA.1 Omicron, winter 2021-22). Those may get revised down, but levels are high across the state, and Kauai peaked at similar levels a few weeks ago. This is very concerning because the virus continues to cause chronic health conditions and excess mortality. Check out the lG version for a musical background (it's good).
Mike Hoerger, PhD MSCR MBA54,805 Aufrufe • vor 1 Monat

Central/SE #Texas have been on fire w/COVlD for 21 days. Levels are extremely high in College Station, followed by near Houston, then Waco. The CDC defines Texas as "very low" because 52% of wastewater sites are very low. That misses the public health opportunity.
Mike Hoerger, PhD MSCR MBA69,820 Aufrufe • vor 4 Monaten


PMC Update, June 8, 2026 The CDC reports COVlD levels are "Very Low" across the US. PMC estimates 1 in 300 Americans actively infectious. BUT there's an outbreak in Central/East Texas. We estimate ≈1 in 30 residents in key counties are infectious. Video 👇 THREAD 1/3 🧵
Mike Hoerger, PhD MSCR MBA70,103 Aufrufe • vor 4 Monaten

PMC COVlD Update Sept 14, 2026 The US has at least 34 states/territories with COVlD outbreaks. These include Alaska, Hawai’i, Guam, Puerto Rico, the US Virgin Islands, Washington, Oregon, California, Nevada, Arizona, New Mexico, Montana, Colorado, Kansas, Oklahoma, Texas, Mississippi, Alabama, Georgia, Florida, Illinois, Indiana, Kentucky, Tennessee, Michigan, Ohio, South Carolina, North Carolina, Virginia, West Virginia, New Jersey, New York, Connecticut, and Maine. There are likely outbreaks in additional states. The summary statistic of 34 only includes counties with observed data, rather than estimated data. For example, Louisiana and Idaho likely have outbreaks, but monitoring is poor. Review all of the graphs and tables weekly at Use the interactive map to get county-level information:
Mike Hoerger, PhD MSCR MBA24,178 Aufrufe • vor 1 Monat
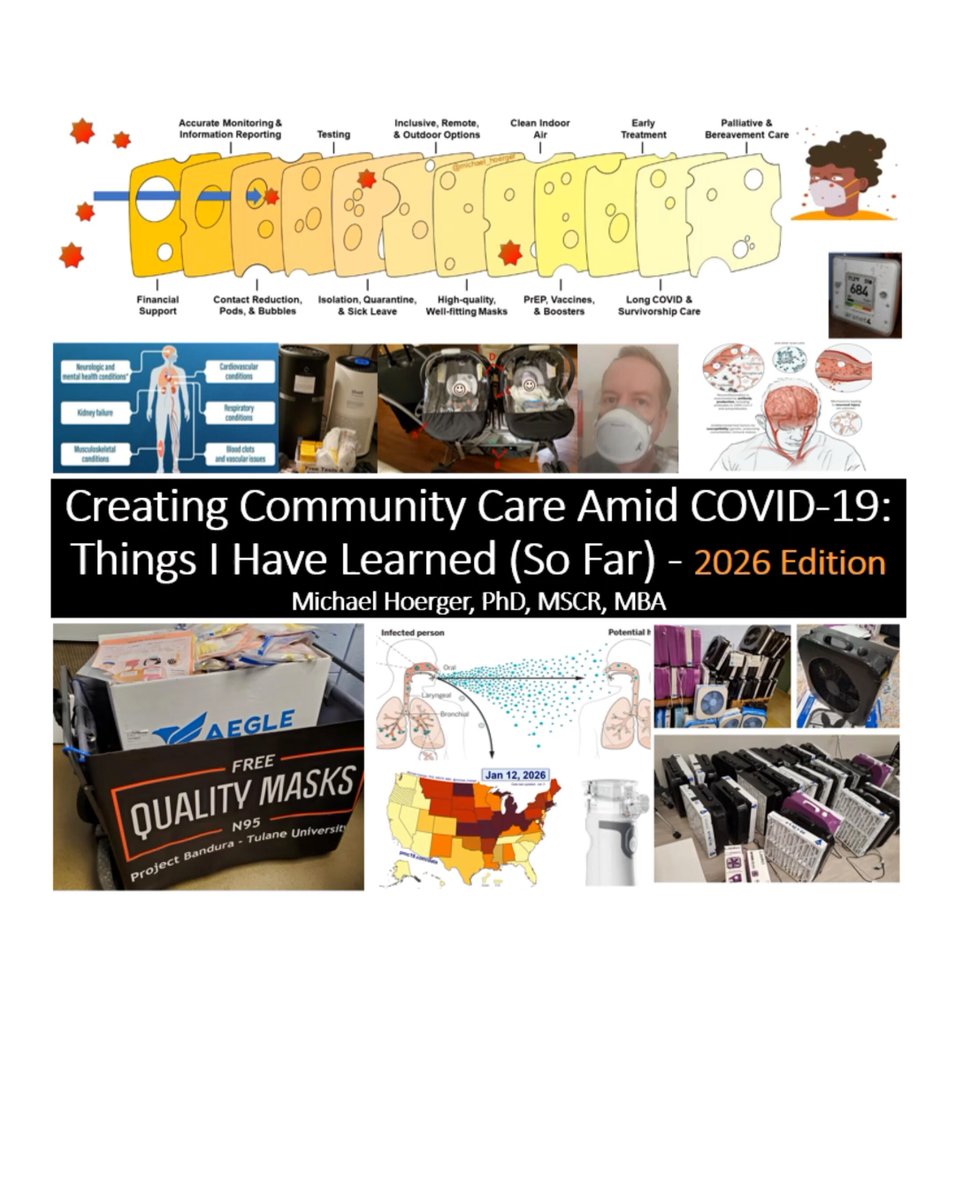
2026 Edition of "COVID-19: Things I have Learned (So Far)." 0:00 Intro 2:07 Transmission Persists 4:55 Morbidity & Mortality Persist 23:07 Psychological Defenses, Politics, & $$$ 29:52 Analogy of Big Tobacco 35:04 Multi-Layered Mitigation 58:00 Practicing Community Care
Mike Hoerger, PhD MSCR MBA120,033 Aufrufe • vor 9 Monaten

Estimated COVlD levels (U.S.) are their lowest since July 15, 2021 -- nearly 5 years ago. All states are low/very low, except those with limited, delayed, or single-site reporting. The estimated 200,000 new daily infections remain ≈20x Dr. Fauci's description of "normality."
Mike Hoerger, PhD MSCR MBA76,021 Aufrufe • vor 6 Monaten


The ongoing winter surge will cause millions of #LongCovid cases in the U.S. Dr. Birx warns of "the aerosol nature of the virus," that "it will never be flu," & "to be cavalier about getting repetitive Covid infections is really a huge mistake." h/t @inducekarmaaa
Mike Hoerger, PhD MSCR MBA268,028 Aufrufe • vor 2 Jahren

PMC Update on #ExcessDeaths 🔥109,000-175,000 people in the U.S. are expected to die as a result of COVID in 2025, based on estimates derived from Swiss Re 🔥COVID deaths expected to be on par with lung cancer in the U.S. in 2025 🔥Death data added to the dashboard
Mike Hoerger, PhD MSCR MBA161,464 Aufrufe • vor 1 Jahr


Is COVlD going away or... Are we about to get slammed by the BA.3.2 variant? 🔥🔥🔥
Mike Hoerger, PhD MSCR MBA54,831 Aufrufe • vor 5 Monaten

1) 5-yr Anniversary of the WHO Pandemic Declaration 🔥10 waves 🔥Covid mortality rivals lung cancer 🔥8 infections/person by 2030 🔥Long Covid as catastrophic 🔥Death trajectories becoming complex 🔥"During Covid" as anti-science rhetoric 🔥Serious ppl take Covid seriously 🧵
Mike Hoerger, PhD MSCR MBA144,498 Aufrufe • vor 1 Jahr


COVlD outbreaks span 33 states/territories. Find your local levels at Stay safe with layered precautions: -Get boosted -Wear a well-fitting N95 respirator, such as a 3M Aura, available at most hardware stores -Increase air hygiene by flipping the HVAC from "auto" to "on," opening windows, or adding air purifiers -Test before gatherings, if exposed, or if experiencing symptoms; the Flowflex brand performs well and can be accessed quickly through an Instacart search of local stores or delivery via Amazon and others -Stay home when sick and test daily -Move events outdoors or online Mere handwashing and coughing/sneezing into one's arm are insufficient against a virus with at least 99.99% airborne transmission. An infected individual exhales virus into the air by breathing, it lingers in the air, and people become infected by inhaling the virus deep into the lungs. Cumulative infections continue to cause long-term health conditions, disability, and excess deaths via downstream heart attacks and other proximal processes. An exposure need not mean infection if one uses layers of precautions.
Mike Hoerger, PhD MSCR MBA18,036 Aufrufe • vor 1 Monat

PMC COVID Report Week of Feb 10, 2025 (U.S.) 🔥1 in 67 (1.5%) actively infectious 🔥We're on the 2nd hump of this #CamelWave 🐫 🔥30 states + DC in the CDC high/very high range 🔥>700k daily infections 🔥1.0-3.8 million Long COVlD conditions from the next month's infections
Mike Hoerger, PhD MSCR MBA138,154 Aufrufe • vor 1 Jahr