

murtaza
@murtaza • 51,415 subscribers
follow to learn | trading journal for financial markets | nfa dyor free tg: https://t.co/toIpTVY3R9
Shorts
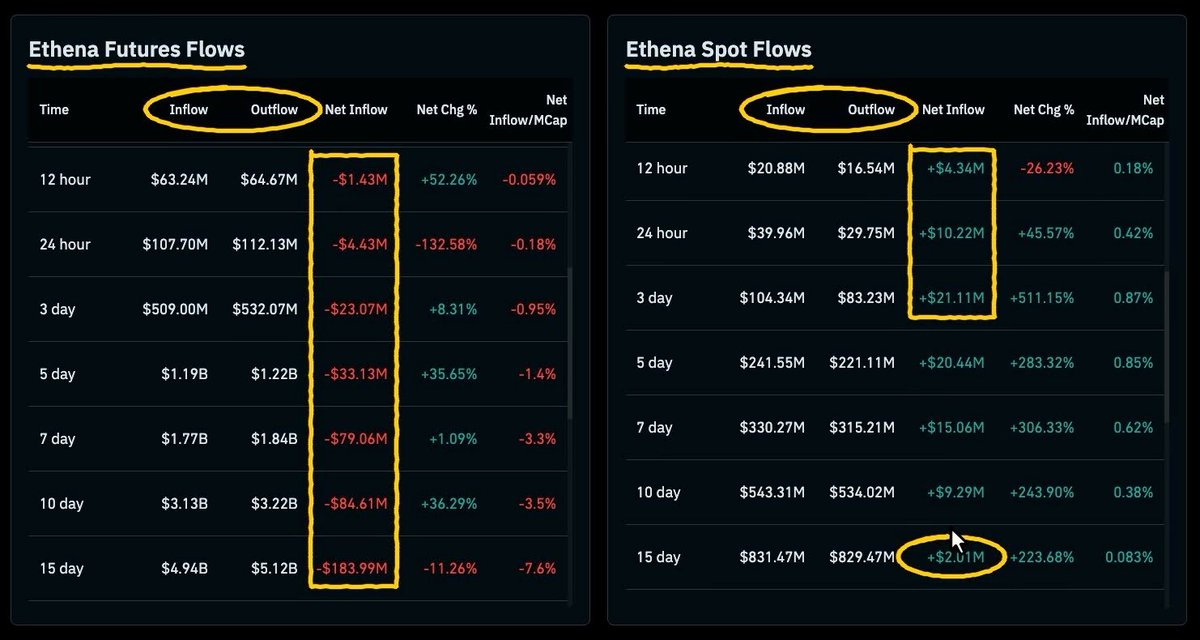
free alpha a coin pumps hard: is the pump real or just leverage? most people find out real vs fake pump after they've already bought the top here's exactly how i use spot flows, with live $ENA and $FET examples save this 👇 🔹 spot flows vs futures flows open any coin on coinglass → scroll to spot flows and futures flows "inflow" = aggressive buying (market buys) "outflow" = aggressive selling (market sells) spot = real buyers futures = leverage 🔹 what i look for 1. spot buying, perps selling = real buyers absorbing shorts. strongest 2. spot buying, perps buying = everyone's in. strong, watch funding 3. spot flat, perps buying = leverage pump. fragile 4. spot selling, perps buying = holders dumping into longs. exit liquidity 5. both selling = weakness, wait 🔸 how i read it check 12h → 15d - green across windows = steady demand - short windows bigger than long ones = buying is fresh - ignore "net chg %" - use "net inflow/mcap" to compare coins of different sizes 🔸 tricks i use windows are cumulative. 24h includes 12h, 15d includes 3d subtract them to see when the buying actually started that's how you catch a trend turning before price shows it 🔹 $ENA spot: 12h: +$4.3M 24h: +$10.2M 3d: +$21.1M 15d: +$2M days 4–15 were ~−$19M of selling. the last 3 days flipped it hard perps: 7d: −$79M 15d: −$184M real buyers stepped in while shorts keep pressing. if spot keeps buying, those shorts become fuel 🔹 $FET spot: 12h: +$2.7M 15d: +$2.4M two weeks flat, then a burst of real buying perps: 7d: −$17M 15d: −$34M 12h and 24h just flipped green spot led, perps followed. it ran 10% within hours 🔸 why this makes me bullish when spot buyers lead, dips tend to get bought fast because real demand is sitting underneath shorts pressing into spot buying = squeeze fuel that's the setup I want in coins I'm holding 🔸 my workflow 1. scan coins I like for spot buying + perp selling 2. rank them by net inflow/mcap 3. use OI and funding to time the entry 4. size bigger in the ones where spot keeps leading 🔸 traps i watch - spot buying + perp selling can be a hedge (buy spot, short perps, collect funding) funding at the default 0.01% won't tell you anything. above it = more likely a hedge below or negative = cleaner signal - small caps: $2M can be one wallet - spot buying but price not moving = big seller absorbing it. wait for price to confirm - coinglass tracks major exchanges only, not on-chain or DEX its not a magic signal, but it filters out most fake pumps and shows you where real money is going nfa
35,054 次观看
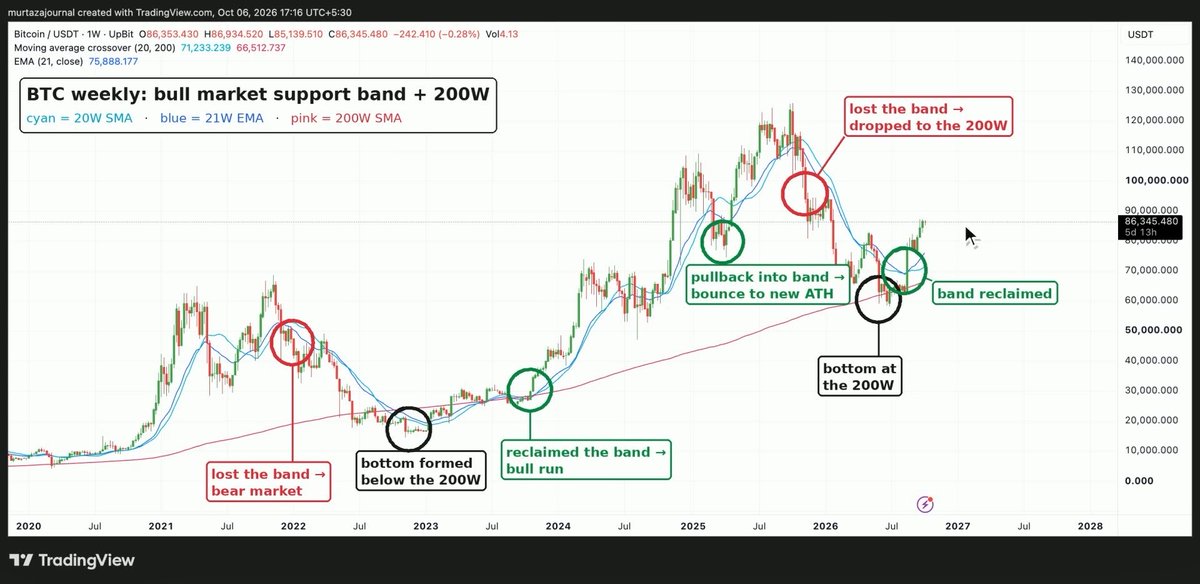
free alpha most people use moving averages wrong. wrong MA, wrong timeframe. here's which ones actually matter and the one setup i trust more than any cross, save this 👇 🔹 which MAs matter EMA = faster, better for trends SMA = slower, cleaner for big levels day trading (5m–1H) 9/21 EMA = momentum 20/50 EMA on the 1H = intraday trend swing trading (4H) 20/50 EMA = swing trend 200 EMA = swing bull/bear line daily 20 EMA = short term momentum 50 SMA = medium term trend 200 SMA = the bull/bear line. one of the most watched MAs in all of markets weekly 20W SMA + 21W EMA = bull market support band 50W SMA = macro trend 200W SMA = cycle bottom zone. $BTC bottoms have historically formed near or below it higher timeframe = more weight 🔸 first: is market trending? rising 200 + higher highs and higher lows = MAs become useful flat 200 + price chopping through it = i ignore MA signals MAs work in trends, not in chop 🔸 the setup i trust the most: fresh 200 the first time price comes back to an untested 200 MA after a trend starts, it tends to react best here but MAs alone aren’t enough. i want a clear trend, confluence with structure and price actually holding up repeated taps usually weaken the level and make a break more likely 🔸 4H trend simplest strategy i use in a bull market: above a rising 4H 200 = i favor longs below a falling 4H 200 = i favor shorts pullback, retest, hold = entry lose it and retest from below = one of the cleanest alt shorts 🔸 when it's late price stretched far above every MA = i'm kinda late i wait for price to cool off first, either a pullback or going sideways while MAs catch up 🔸 bull market support band 20W SMA + 21W EMA on $BTC, most useful setup in crypto $BTC holds above it in bull markets and bounces off it on pullbacks lose it on a weekly close = trend is getting weaker right now: $BTC at ~$86K, back above the band (20W ~$71K / 21W ~$76K). 200W at ~$66.5K 🔸 golden cross / death cross 🟢 golden cross = 50 SMA crosses above 200 SMA 🔴 death cross = 50 SMA crosses below 200 SMA both lag but still useful death crosses in bull markets often come near local bottoms so i use them as confirmation, never as an entry on their own cross works on every timeframe. what changes is how long it lasts 1. long term: 50/200 daily 2. swing: 50/200 on the 4H, or 20/50 daily 3. day trading: 9/21 EMA on 5m–15m, or 20/50 EMA on 1H lower timeframe = more crosses, more fakeouts, shorter moves filter that saves me from most fakeouts: i only take crosses in the direction of the htf 4H golden cross + price above a rising daily 200 = aligned, i look for an entry 4H golden cross + price below a falling daily 200 = countertrend, probably a trap 🔸 how i actually use MAs 1. price above a rising MA = trend up. below a falling MA = trend down 2. slope matters more than the cross. flat MA = no trend 3. reclaim + retest = entry. close back below + rejected retest = failed reclaim, i'm out 4. best levels are where MAs line up with VWAP or horizontal support/resistance 5. wicks don’t count, only actual candle close 🔸 for alts MAs work worse on low liquidity alts. fake breaks everywhere i check $BTC and $OTHERS against daily 200 and the bull market support band first if the market isn't trending, alts usually won't hold their MAs either 🔸 my cheat sheet, screenshot this trend: 200D SMA bull market health: $BTC 20W/21W band cycle bottom zone: $BTC 200W best entries: first tap of a fresh 200, or reclaim + retest avoid: chop, flat MAs, price stretched above MAs, a 200 tapped 4 times invalidation: close through the level + failed retest MAs don't give me buy/sell signals, they show me the trend and where it's likely to go. nfa
20,538 次观看

best case for me is $BTC dump over the weekend to 80-81k trap late shorts then full send to $100k in uptober and take revenge for 10/10 last year
21,258 次观看