
SEPTINVESTING
@septinvesting66 • 7,401 subscribers
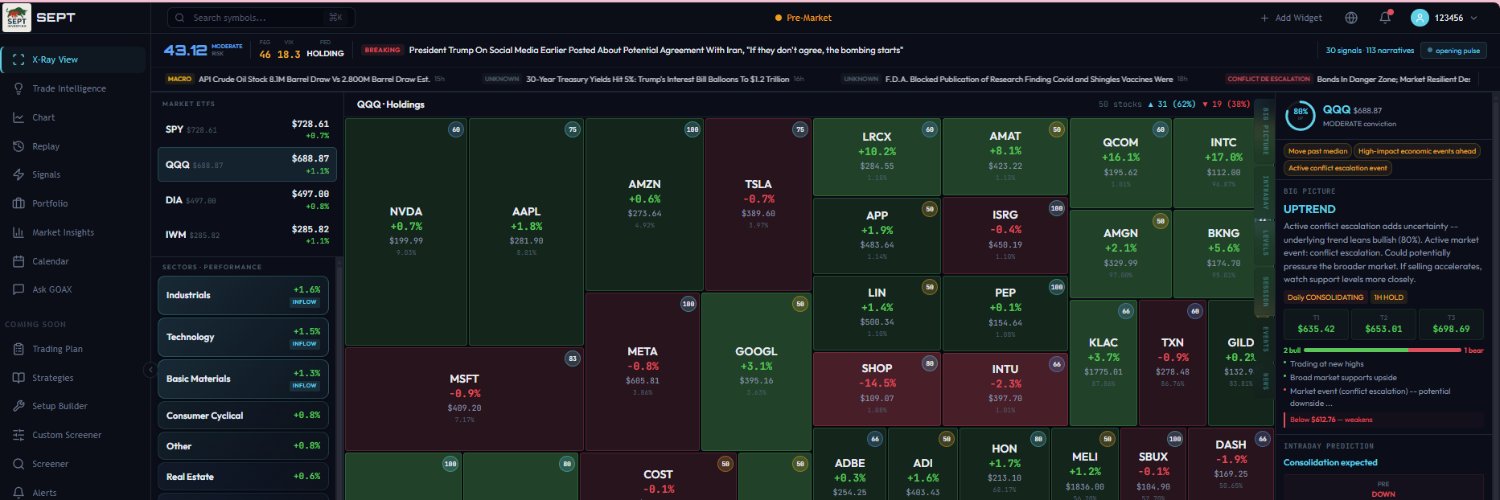
SEPT Platform: Price action trading intelligence & free live community. Not financial advice, DYOR
Videos

Today is Tuesday, June 9th. Here are the stocks on my watchlist: $MRVL The stock is pushing into a key resistance zone at $300–$304. Draw a trendline and you’ll see it’s still in a downtrend unless price can break and hold above $304. On the downside, keep an eye on the $284 area. If price breaks below and then forms a lower high, that would signal a potential trend‑structure shift. $NVDA Price is sitting right at major resistance around $211. Above & hold: next resistance levels are $216, then $221. Reject from $211: supports sit at $206, then $204. $MU Price is trading just under the $100 level, a key resistance. Break & hold above $100: opens the door for another leg higher toward the previous high. Reject from $100: next support sits near $96. Disclosure: This video is for educational purposes only and is not financial advice. Nothing here is a recommendation to buy or sell any security.
SEPTINVESTING33,256 Aufrufe • vor 25 Tagen

6-12 stock watchlist Today is Friday, June 12th. The market bounced back with strong buying pressure after yesterday’s selling, and it’s now sitting right under a key resistance zone at $721–$724. Break & hold above: likely retest of the previous high. Reject: expect more range‑bound action. Here are the stocks on my watchlist today: $NBIS Positive catalyst with the company joining Nasdaq. Price is consolidating above yesterday’s close, showing strength. Support: $230 — as long as this level holds, the uptrend structure remains intact. Bias: continuation higher if $230 continues to act as a floor. $RKLB With the market’s attention on SpaceX’s IPO atmosphere, RKLB is also holding well. Price is consolidating above yesterday’s close, maintaining trend strength. Uptrend holds while above: $115.24 Next resistance: $130 psychological level $GOOG Unlike the previous two, GOOG is still showing downtrend structure. Resistance: $360 Stronger resistance above: $370 Price needs to reclaim these levels to shift momentum. Disclaimer: This video is for chart technical analysis educational purposes only and is not financial advice. Nothing here is a recommendation to buy or sell any security.
SEPTINVESTING26,122 Aufrufe • vor 22 Tagen

6-10 stock watchlist for today Here are the stocks on my watchlist: $ORCL Price is sitting right on key support around $200. Holds above yesterday’s low (~$197): next resistance is $208. A break and hold above $208 opens the door for further upside. Breaks and stays below $197: downside momentum continues. $TSLA Yesterday’s close is acting as key support. Break & hold above $397: upside targets sit at $414–$416. Fail to break $397 or break below yesterday’s low: expect more downside pressure. $SMCI Price is sitting right on major support at $36. Support holds + break above $38: looking for continuation to the upside. Cannot hold above $36: next support sits near $32. Disclaimer: This video is for chart technical analysis educational purposes only and is not financial advice. Nothing here is a recommendation to buy or sell any security.
SEPTINVESTING25,853 Aufrufe • vor 24 Tagen


6-15 stock watchlist $QQQ $SMCI $AMZN $ORCL The market opened with strong momentum this morning — Trump’s ceasefire announcement sparked a broad gap‑up, and price is now pressing directly into the key $738 level. A clean break and hold above $738 opens the door toward the $748 magnet. Below is my stock watchlist for today $SMCI Price is sitting right beneath a key intraday trigger. Break & hold above $33 → next resistance sits at $36–$37. Support at $28.6 → if this level fails, expect further downside pressure. $AMZN Well‑defined structure with clear reaction zones. Break & hold above $244 → upside target at $254. Reject from $243 → price may rotate back to retest the $232 support zone. $ORCL Watching how price behaves around support. First support: $184 Next support: $182 As long as these levels hold, the upside target at $204 remains in play.
SEPTINVESTING18,564 Aufrufe • vor 19 Tagen

6-11 stock watchlist Today is Thursday, June 11th. Here are the stocks on my watchlist: $ONDS Price is sitting right under key resistance at $10. Break & hold above $10: next resistance is $10.61, and $13 is the next resistance to watch for next week. Reject from $10: support sits at $9.15. A break below $9.15 opens the door for more downside momentum. $INTC. Price is approaching major resistance around $114. Break & hold above $114: next resistance is $118-$120. Reject from $114: expecting downside. Supports are $104, then $100. $RGTI. Price is consolidating inside yesterday’s range: $21–$19. Break above $21: upside momentum may kick in. Next resistances: $22.7, then $23.6. Break below $19: downside opens toward $17.8 support. If you don’t know how to find key levels, SeptInvesting’s SmartChart automatically highlights them for you — all based on real‑time buy and sell data Disclaimer: This video is for chart technical analysis educational purposes only and is not financial advice. Nothing here is a recommendation to buy or sell any security.This
SEPTINVESTING21,154 Aufrufe • vor 23 Tagen

$DXYZ Trade Recap I want to share my full trading journey on $DXYZ, from the first entry to the final exit. I first posted this stock on April 30th and took my initial position at $31.58. Within seven days, the stock exploded to $60+, and my position doubled quickly. My usual rule is simple: When my investment doubles, I sell all or most of the position. This time, I only sold half. On May 13th, I bought back the shares I sold, around $51, and shared that update as well. Price pushed back to the $70 area, but after forming a clear double top and failing to break $71, I sold the shares I added on May 13th at price $59. Soon after, the stock dropped sharply to the $50 area. I bought again around $50, with a stop slightly below $47, and that stop was hit. Later, when price pulled back to the $38 range, I entered again and waited for price action into the SpaceX IPO. I eventually exited all remaining shares in premarket before the IPO, around $36. That completes my entire trade sequence on this name. I made a profit overall, but not as much as I originally expected. The key reason is: Price never broke above the previous $70 resistance. Looking back, the part I didn’t execute well was letting my bias take over. I believed the stock could go much higher, and because of that, I didn’t follow my usual discipline: I didn’t sell the entire position when I doubled my investment the first time. I didn’t sell everything when the stock failed to break the previous high. Both moments were clear opportunities to lock in the full gain. Still, it was a solid learning experience and a profitable trade overall. Thanks for reading, and I hope this recap helps others stay disciplined in their own trading.
SEPTINVESTING18,592 Aufrufe • vor 20 Tagen

6-15 trade recap At the open, I closed out the $QQQ calls I bought last Friday. After that, I took a long position in $AMZN once price broke above $244. But instead of giving a clean continuation, price consolidated above $245 for the entire session. I tightened risk by moving my stop just below the consolidation range and shifted my focus elsewhere. My second trade was $SMCI. Price rejected the $32 / premarket high area, which gave me a short setup. However, downside follow‑through was limited, and the stock spent most of the day moving sideways. I adjusted my stop to just above $31.3 and will reassess tomorrow. That’s it for today — a slow, low‑momentum session overall. Thanks for listening.
SEPTINVESTING15,524 Aufrufe • vor 18 Tagen


6-10 Trade recap This morning I highlighted $ORCL in my morning video, noting that the $197 area was key support. At the open, I entered long at $198 with my stop slightly below the premarket low. The stock then surged to $208, broke through resistance, and pushed another $4. Since the stock’s ATR is $12, the move had already completed its full ATR expansion from $198 to $212, so I closed the entire position. If you want a cleaner way to track ATR, the SeptInvesting chart has an ATR button — it shows you instantly when a stock has reached a full ATR move, helping you avoid chasing highs and lock in profits at exhaustion zones. The second stock I traded from my morning video was $SMCI. Price broke through support, so I entered SHORT immediately and took profit around the $32 support, exactly as outlined in the morning plan. For $TSLA, price never broke above $397, so I stayed on the sidelines.
SEPTINVESTING14,963 Aufrufe • vor 23 Tagen
Keine weiteren Inhalte verfügbar