Loading video...

Video Failed to Load

Go Home

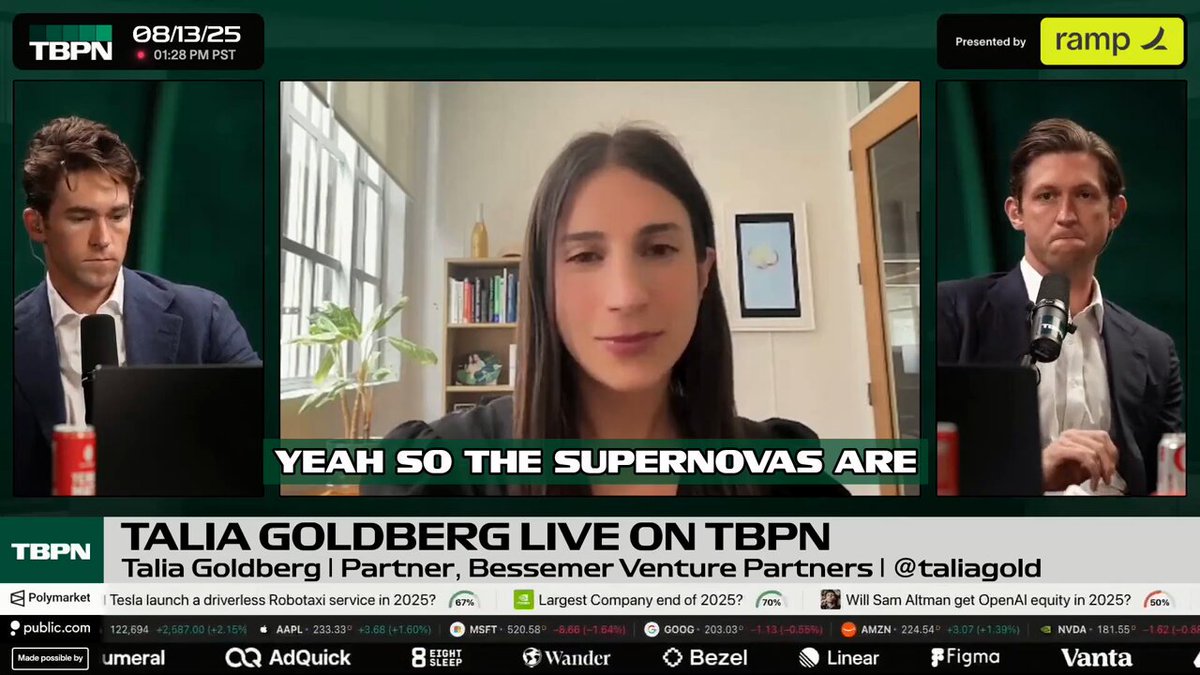
70% gross margin. 10% gross margin. Same sector, same growth rate, completely different business. Most investors still value companies off a revenue multiple. That habit quietly breaks the moment you leave classic SaaS. Michael B. Gilroy , co-founder of Marathon Management Partners, $400 million across software and fintech. "In...

25,559 views โ€ข 3 months ago โ€ขvia X (Twitter)

2 Comments

Fred Pope's profile picture
Fred Pope3 months ago

@MBGilroy 70% or 10% GM doesnโ€™t matter if the cash conversion is trash. Cash flow tells everything. Everything else is noise.

David Weisburd ๐Ÿš€'s profile picture
David Weisburd ๐Ÿš€3 months ago

Full episode:

Related Videos

Morgan Stanley just raised their 2027 AI capex forecast to $1.1 trillion and that number still doesn't include SpaceX or a lot of the other AI companies (Save this). When you factor those in, the real 2027 figure is probably closer to $1.5 trillion and AI lab inference revenue combined is tracking toward $300 billion in 2027. On its surface that ratio sounds alarming, spending $1.5 trillion in capex to generate $300 billion in revenue. But the framing collapses the moment you examine two things the bears consistently ignore, gross margins and the revenue trajectory. Gross margins on inference revenue are running at 60 to 70 percent. That means the $300 billion in inference revenue generates $180 to $210 billion in gross profit and that number compounds rapidly as utilization scales on infrastructure that is already built and paid for. The Capex is not being deployed against today's revenue but rather being deployed against a revenue trajectory that has shown no signs of decelerating. To understand how aggressive that trajectory actually is, consider that Morgan Stanley's $1.1 trillion hyperscaler forecast is nearly double what analysts projected for the same year just twelve months ago And they described the demand as inelastic, meaning it is not slowing down regardless of rising costs, tighter financing conditions or geopolitical risk. The AI industry ended 2025 tracking well over $200 billion in combined inference revenue and the growth rate since then has continued to accelerate rather than flatten. Anthropic alone scaled from negligible revenue to a $30 billion annualized run rate in approximately 18 months while OpenAI is tracking toward $280 billion in annual revenue by 2030 from $13 billion in 2025. There is also a structural reality in the capex number that the bears never account for. Roughly 35 percent of total AI spending goes toward training, building the next model generation which is not revenue-generating in the current period. That means only about 65 percent of the $1.5 trillion in capex is actually deployed against the inference infrastructure that earns revenue today. When you apply the 60 to 70 percent gross margin to the revenue that sits on top of that 65 percent figure, the economics look substantially better than the headline capex to revenue ratio implies. Every CEO who has been closest to this buildout has consistently underestimated it and Jensen Huang projected $1 trillion in AI capex two years ago and was called delusional. Dario Amodei said in early 2026 that AI revenues would reach the low hundreds of billions by 2028 and trillions before 2030 and given where Anthropic's own revenue trajectory is today, he is likely revising those numbers upward. The pattern here is consistent, every time someone models the revenue ceiling, the actual number breaks through it faster than expected. Come join Milk Road Pro for our full breakdown, the real unit economics of the AI inference buildout, how the capex to revenue ratio evolves over the next three years, and our entire AI thesis! Link below!

Milk Road AI

21,141 views โ€ข 4 months ago

I built this CEO dashboard for my client. And it changed how they run their entire business. 1/ Before this dashboard, they were making decisions in the dark. Revenue, profit, and marketing spend scattered across spreadsheets and platforms. - No single source of truth. - No real-time profit and loss visibility. - No way to see which channels were actually driving growth. 2/ Hereโ€™s what this dashboard delivers: Executive Overview: โ†’ $102K total revenue tracked live โ†’ $79.8K gross profit and 78% gross margin calculated automatically โ†’ 15% contribution margin, updated in real time โ†’ $5,880 revenue this week, always visible Profit & Loss Clarity: โ†’ Visual breakdown of revenue, COGS, transaction costs, and marketing spend โ†’ Instantly see contribution margin and where profit is made (or lost) Revenue & COGS by Type: โ†’ Instantly compare new vs. returning revenue and costs โ†’ Know exactly whatโ€™s driving growth and whatโ€™s eating margin Marketing Spend by Channel: โ†’ Compare Meta vs. Google spend โ†’ See which channel is delivering the best ROI Revenue vs. Marketing Spend Trends: โ†’ Visualize how every marketing dollar translates to revenue over time Conversion & Order Insights: โ†’ Track sessions, orders, conversion rates, AOV, MER, CPA, and more live Dark mode or light mode? โ†’ This dashboard looks stunning with these two options. No more squinting at numbers. Details are always crystal clear. 3/ The transformation was instant: Before: โ†’ Hours spent pulling numbers from different platforms โ†’ Guessing at profit and loss โ†’ No clarity on which channel was working After: โ†’ 10 minutes daily reviewing live insights โ†’ Real-time, data-driven decisions โ†’ Confident budget allocation and growth planning 4/ The business impact: โ†’ Faster decisions โ†’ Smarter optimizations โ†’ A client who finally feels in control of their numbers This isnโ€™t just a dashboard. This is executive intelligence. Every metric tells a story. Every trend reveals an opportunity. Every insight drives profit. Want a dashboard that makes your business look (and run) like a million bucks? I build custom dashboards & AI automation systems that give you real-time clarity and control. - Real-time data - Predictive insights - Automated reporting - Intelligent alerts Ready to stop guessing? Like + Comment "CEO DASHBOARD" and Iโ€™ll DM you a free resource to help you track the top 5 metrics every CEO should monitor.

Lian Lim | Dashboard & AI Automation Expert

116,069 views โ€ข 1 year ago