正在加载视频...

视频加载失败

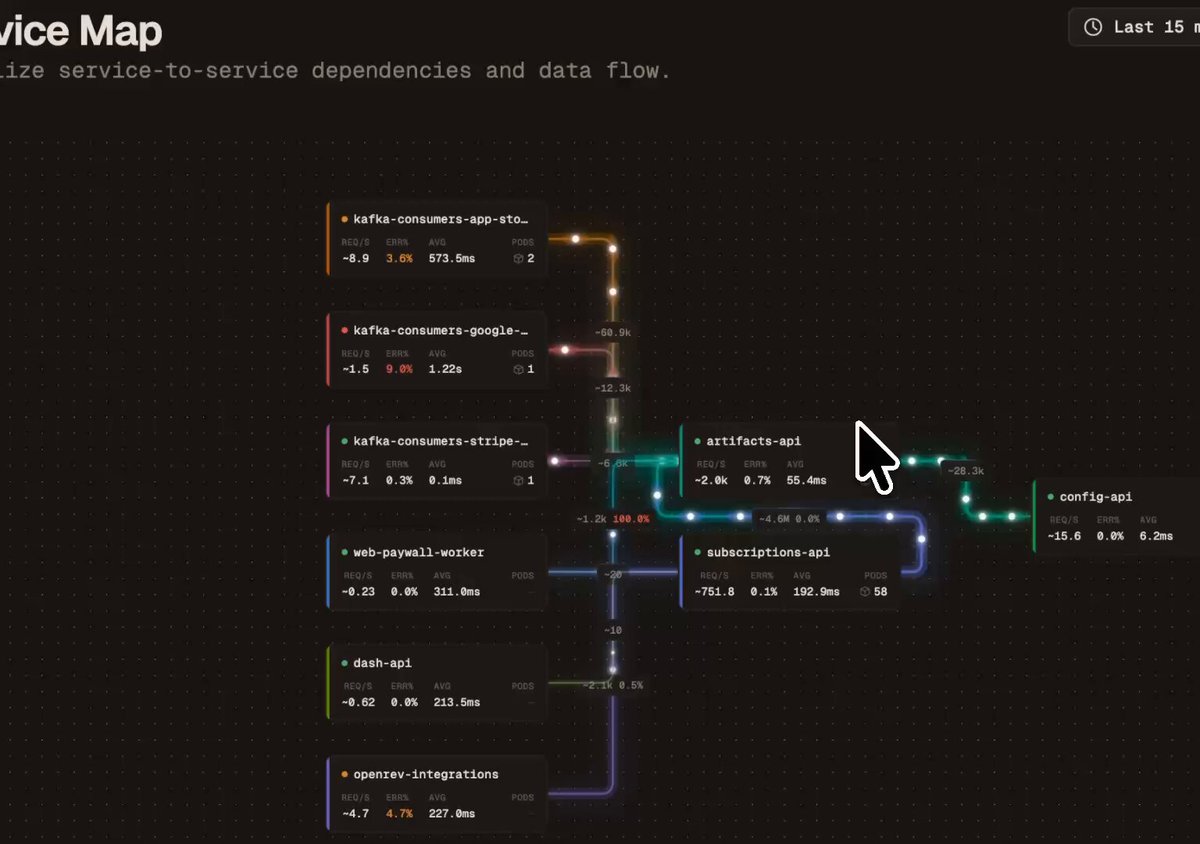
All types of databases, Redis, Postgres, Clickhouse, Mysql etc. now display important stats and metrics aswell as most run queries in the Maple service map

245,707 次观看 • 5 个月前 •via X (Twitter)

35 条评论

BRYCE 的头像
BRYCE5 个月前

This was my visual concept for my data base @alxui_ux

Lex Tang 的头像
Lex Tang5 个月前

That's so cool! When the traffic is high, do these little dots become more dense and move faster?

Krystian Gebis 的头像
Krystian Gebis5 个月前

How has this not existed prior to now

Bruce_Lee 的头像
Bruce_Lee5 个月前

@grok github

Andrei Otel 的头像
Andrei Otel5 个月前

The UI is so clean... It brings factorio vibes, conveyor belts but for data visualization, love it!

Fredrick Duhia 的头像
Fredrick Duhia5 个月前

What if you had factorio for your databases? Now you can

Werner Kasselman 的头像
Werner Kasselman5 个月前

first thing I thought of seeing this. Spotlight on XYZ was amazing! Everything old is new again. Spotlight on SQL Server (now Spotlight on SQL Server Enterprise by Quest Software) initially launched in the early 2000s, gaining popularity around 2002–2003 as a groundbreaking visual dashboard for tracking database performance.

Samuel 🦤 (🧱,🔥) 的头像
Samuel 🦤 (🧱,🔥)5 个月前

You generate these from OTEL?

Makisuo 的头像
Makisuo5 个月前

Yes all from your otel data, might extend it with cloud specific data in the future, but currently it’s 100% otel powered

Samuel 🦤 (🧱,🔥) 的头像
Samuel 🦤 (🧱,🔥)5 个月前

❤️

Nikao 的头像
Nikao5 个月前

That is so visually appealing, whoa

Panos Pitsi 的头像
Panos Pitsi5 个月前

This is what I though computer science would be like when I was a kid

Shubham Sharma | AI & Tech 的头像
Shubham Sharma | AI & Tech5 个月前

The UI is so clean... It brings factorio vibes, conveyor belts but for data visualization, love it!

Ugur Akdogan 的头像
Ugur Akdogan5 个月前

and this is system design version

Parth Parekh 的头像
Parth Parekh5 个月前

Could you share the github repo link if possible ?

Priyansu Kumar 的头像
Priyansu Kumar5 个月前

This is one of those features that looks cool in a demo but becomes insanely useful the first time production starts acting weird.

Yoshik 的头像
Yoshik5 个月前

curious to understand how does this app help create better systems?

IMRΛN 的头像
IMRΛN5 个月前

Damn. I might have to switch. Well done.

Hiago 的头像
Hiago5 个月前

cool dashboard sir

Warlord007 的头像
Warlord0075 个月前

this is amazing

VincentFree 的头像
VincentFree5 个月前

Can you tell us what this is called?

Emir Kılıç 的头像
Emir Kılıç5 个月前

ne ara geldi bu kadar feature

buildwithjay 的头像
buildwithjay5 个月前

live query stats per db inside the service map is the thing i always end up wanting and never have in one place. does it surface slow query outliers too or just aggregate counts. the p99 is usually where the real fire is hiding

AI Mastery Guide 的头像
AI Mastery Guide5 个月前

Seeing your most run queries visualized alongside service dependencies in real time changes how fast you actually spot what is causing problems

Dominic 的头像
Dominic5 个月前

Did you make that app man? Looks sweet

DalioWild 的头像
DalioWild5 个月前

wow!

Junction 的头像
Junction5 个月前

this looks stunning

Julio Espinosa 的头像
Julio Espinosa5 个月前

Cool

Sara Blu 的头像
Sara Blu5 个月前

Clean work. Love how DB metrics sit right next to service nodes. Makes bottleneck hunting faster. That blue UI fits my timeline perfectly.

Yevhenii Hyzyla 的头像
Yevhenii Hyzyla5 个月前

It's fantastic work!

RoboRent 的头像
RoboRent5 个月前

Wow.

Junior Rodrigues 的头像
Junior Rodrigues5 个月前

looks like amazing, i mean, software really should be beautiful like this

Rapid 的头像
Rapid5 个月前

Since it's OTEL does that mean I can integrate Cloudflare or since OTEL is not real time in Cloudflare as I understand it won't work?

Chí Jony 的头像
Chí Jony5 个月前

@grok github

incpo 的头像
incpo5 个月前

Is it compatible with signoz or i need to choose only one metric service?

相关视频

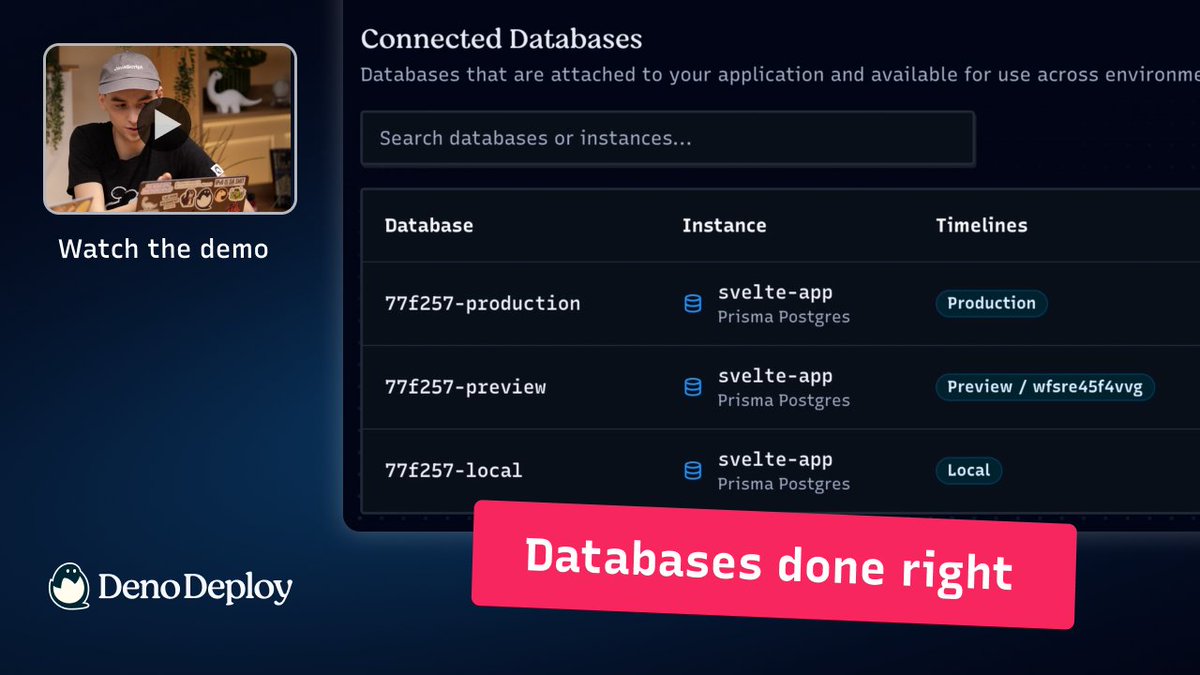
Special treat for the Andy Pavlo (@andypavlo.bsky.social) fans out there: an in-depth discussion about what happens to databases when billions of AI agents hit them, his move to build a research lab at ClickHouse, and plently of hot takes on the database market (Postgres, vector, graph, GPU etc) 00:00 Cold open & Intro 01:21 From vector databases and RAG to the age of agents 04:09 Neon's stat: agents create 80% of databases? 07:25 Why agents keep deleting production databases 08:19 Guardrails: the toddler-and-stairs rule 10:51 The four eras of database volume: 10–100x more queries 15:10 Agent memory: files vs. databases ("everything is a database") 18:24 Which database do AI models recommend? 19:25 "It cites me back to myself" 23:14 MCP for databases, and text-to-SQL from 60% to 99.5% 27:09 Trust an agent the way you'd trust a junior developer 27:47 Can AI build an entire database? Opus 4 and the CMU projects 29:57 60% of open-source databases now have AI commits 30:43 Ten years of self-driving databases, Peloton to today 33:52 What LLMs changed: 85% of the tuning in 15 minutes 35:42 Should anyone still study databases? 38:27 Free CMU courses, the DJ, and the Wu-Tang final exam 42:09 Why start a research lab inside ClickHouse? 45:53 Why ClickHouse looked like vaporware in 2016 47:46 What makes ClickHouse fast: columns, vectors, Snowflake's lineage 52:22 Why Databricks, Snowflake and ClickHouse all added Postgres 58:15 Vector, graph and GPU databases: thumbs up or down? 1:08:34 Is the database market stagnant? "A cheetah on cocaine in a Ferrari" 1:10:14 The relational model is arithmetic; SQL as the new assembly 1:11:59 Larry Ellison, Linux, and why databases still matter

Matt Turck

20,254 次观看 • 26 天前