Video wird geladen...

Video konnte nicht geladen werden

Zur Startseite

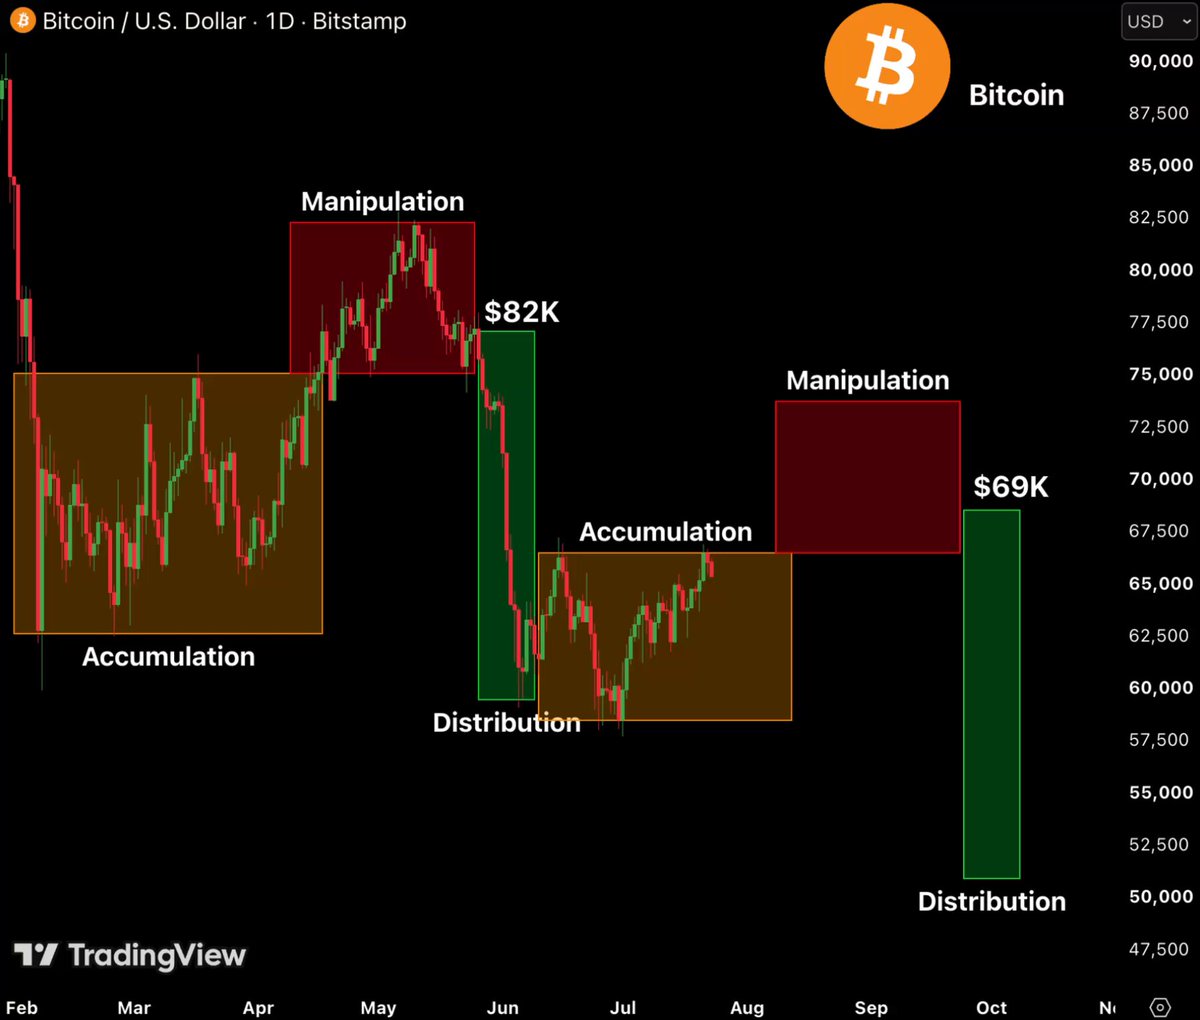
BITCOIN ABOVE $75K CHANGES EVERYTHING. MarketMaker Buy Model: three phases done. Distribution. Manipulation. Accumulation. All complete. What's next: re-accumulation at $80-95K. Then $142K. But only if $75K holds. Lose it: model resets, back to the grey zone. Hold it: the roadmap to $142K stays intact. One level. Everything depends...

36,589 Aufrufe • vor 2 Monaten •via X (Twitter)

0 Kommentare

Keine Kommentare verfügbar

Kommentare vom Original-Post werden hier angezeigt

Ähnliche Videos

🚨 READ THIS CAREFULLY Everyone thinks Bitcoin is breaking out. The chart says something completely different. Bitcoin is now forming a Wyckoff accumulation pattern. Most traders see accumulation and think the danger is over. That’s exactly how they get trapped. Bitcoin has already completed the first major reaction after the local high near $82.5K. That is the Relief Rally phase. And historically, this stage is followed by downside. But the setup is not that simple: - Drop toward $60K (finished) - Secondary Test formation (completed) - Bounce back above $75K (done) - Re-sweep of the lows (next) - Cycle bottom formation (coming) That’s how accumulation works. It doesn’t reward people who chase every bounce. It rewards people who understand the structure. Most traders only think in one direction: “BTC is pumping. Bottom is in.” Wrong. Real accumulation is messy. It shakes out early buyers. It traps breakout traders. It forces people to sell the bottom twice. That’s why my main focus is still the same: A potential <$50K bottom. Not because Bitcoin is dead. Because this is where the real accumulation phase can finish. For the record, I was the only one publicly calling the exact bottom at $16,000 three years ago and the top at $126,000 in October. If you missed those calls, don’t worry. I’ll call the next one too. Turn notifications on. If you’re not following yet, you’ll understand why that was a mistake later.

Alex Mason 👁△

2,014,801 Aufrufe • vor 2 Monaten

Something interesting is going to be released soon... ✨ Kitt The Inner Circle Trader "If I had to trade only one model for the rest of my life, considering everything I've publicly disclosed, my choice would be either the second stage of re-distribution in an MMSM or the second stage of re-accumulation in an MMBM. With either of these, I believe I could consistently generate substantial profits without the need to explore alternative strategies. These models rely on specific components of both the buy and sell sides of the market curve, which are directly interconnected. This isn't a matter of identifying support and resistance levels; it's about understanding the logic of order flow. In the case of the market maker sell model, I focus on identifying a pool of liquidity beneath the initial consolidation. When I spot this sellside opportunity, I patiently await a reversal. This reversal should lead to a drop of at least 50% from the smart money's reversal point down to the sellside liquidity. If it achieves this, and then begins to rally once more, I'll look to correlate it with the other side of the curve, where the market previously rallied before reversing. This will provide me with an array that initially signaled a bullish trend but now acts as a reversal indicator. This marks the second stage of distribution or redistribution, and it usually happens swiftly, pushing prices towards the sellside. In essence, I'm waiting for a unicorn setup, where all the pieces align perfectly, and I have everything in my favor. I'll risk 5% on such a trade. This approach involves re-accumulation, where the sellside drops down to 50%, and then I match it with another array to capture the reversal. Now, picture a market maker model involving a consolidation phase where relative equal lows are formed, followed by an upward rally, possibly forming a consolidation that resembles a bull flag pattern. Subsequently, it rallies out of that consolidation. Sometimes, it may create a second stage of re-accumulation as it trades towards a premium array level—a level I consider a liquidity draw. If I'm feeling bullish, I'd aim for that level. I don't necessarily need to be there at the exact moment; I might spot the opportunity later and act accordingly. If it's reacting off of a level, that should offer sellside. So, you know where sellside delivery. The market should drop down. So, I'm anticipating price reacting and reversing at the smart money reversal once it starts to break down. If it goes back up a little bit, that's the smart money reversal. Low risk sell is the next stage and then they'll drop. When we reach the low-risk sell, it's important that the drop reaches at least 50% of the total range from the smart money reversal to the sellside I'm targeting. As long as it accomplishes this, I have confidence that the subsequent rally will reach a premium array on the left side of the curve before the market makes its high and reverses. Why would it do that? Because it's part of a larger continuation. So when and how would I determine when it's going to fail ,that first leg of re-distribution on the sell side, if it doesn't pierce 50% of that range from the smart money reversal down to the sell side liquidity. If it doesn't do that, then it's not going to go down there. It's going to be a continuation of reverse and go the other way." #ict #ICT

LumiTraders

387,225 Aufrufe • vor 2 Jahren