Loading video...

Video Failed to Load

Go Home

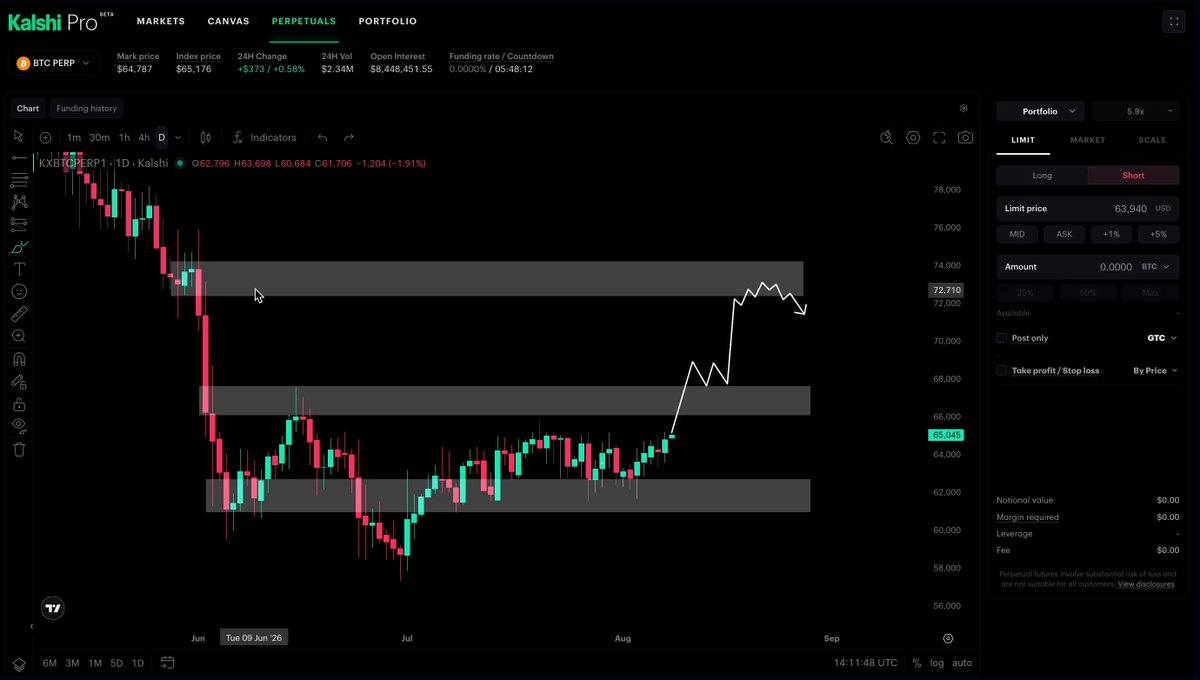
🚨 BTC JUST LOST THE RANGE HIGH 🚨 After yesterday’s push above $82K, BTC has already slipped back below the old range We now have a confirmed close below $80.8K, so the question is whether that former resistance zone starts acting as resistance again If it does, I’d expect...

26,662 views • 16 days ago •via X (Twitter)

9 Comments

NoName's profile picture
NoName16 days ago

Get $25 for $50 of trading volume through my link P.S here you'll have the lowest fees among all perps

NoName's profile picture
NoName16 days ago

More alpha in my TG:

Klarck's profile picture
Klarck16 days ago

this is where trapped breakout longs start getting nervous

hira's profile picture
hira16 days ago

watching that 80.8 retest close rn

Leviathan's profile picture
Leviathan16 days ago

👀👀👀

Shridlock's profile picture
Shridlock16 days ago

Taped your doors on our map at 18:34Z: $75M of longs to 77,000, fattest $28M at 78,582. $81M of shorts to 84,000, fattest $33M at 82,163. Loaded 0.9 to 1. Sunday's candle is the judge

Pepesso's profile picture
Pepesso16 days ago

A clean reclaim of the range high would invalidate a lot of the bearish pressure

Linton Worm (🍏,🪱)'s profile picture
Linton Worm (🍏,🪱)16 days ago

This is classic range behavior until proven otherwise

Grace🇳🇬🇬🇧⚔️🔱😍's profile picture
Grace🇳🇬🇬🇧⚔️🔱😍16 days ago

Stfu

Related Videos

📺 $TSLA CLOSE BELOW $364.76 TODAY → A SHORT SETUP ACTIVATES Please ❤️like and 🔁share with fellow Tesla traders/investors #Tesla is currently trading inside a wide range between $342.95 (support) and $437.58 (resistance). A confirmed close above $437.58 = strong bullish signal, which opens the path toward the $540s (long-term channel top). It would likely mark a major low already in place for the year. A weekly close below $339.52 (≈1% below support) triggers a 3–5 month sell signal with the downside target of ~$220s ($224.94 area). So, #TSLA is in a range-bound market until proven otherwise — but the breakout (up or down) will be decisive and large. * The key resistance level this week is at $398.25. This level has repeatedly rejected buying pressure. The important filter level is $364.76 (5/8 Fibonacci). Above it → selling pressure is contained, below it → opens downside momentum toward $342.95. $TSLA is currently sitting just above the line that matters most in the short term. * If $TSLA closes today above $377.12 → momentum shift higher, with a likely move to $398.25 within 2–3 days. If #TSLA closes below $364.76 → a short setup activates, with the downside move toward $342.95. We expect a choppy, back-and-forth inside the range. Possible path: bounce → upper $390s, then reject → drift lower again, and then repeat until breakout. * So, $TSLA is neutral to slightly bearish bias below $377.12. Constructive only above $377.12. Look out for $364.7 – danger zone is below it. * Watch the full $TSLA Trading Plan for Apr 27, 2026 in this short video🔽

Wicked Stocks

22,820 views • 4 months ago

📺 $TSLA BULLISH MOMENTUM IS NOW ACTIVE Please ❤️like and 🔁share with fellow Tesla traders/investors #Tesla broke below $437.58 earlier, which projected the downside target at $342.95. This level was successfully tested recently, confirming it as a major support zone. From that test, the thesis flips bullish: expect a rotation back up toward $437.58 within 2–3 months, with potential extension to $440 s into late May and $450 s into June. The downside cycle is likely completed → now transitioning into a medium-term recovery phase. * $398.25 (descending weekly channel top) is now the most important near-term level. This level is dynamic: it drops into the low $390 s (~$393) next week. It's important because it’s the gatekeeper for the continuation higher. A close above ~$393–$398 next week → bullish confirmation, which opens the path to $437.58 within 3–5 weeks. If rejected, expect range-bound trading or a pullback. * Intraday Structure – Support is a low $372 area. – Resistance is $386.44 (short-term channel top) A break above $386.44 → acceleration toward $398. So, if $TSLA opens strong above $386, a fast push to $398 becomes very realistic. * This isn’t a straight-line rally setup. It’s a range with directional bias: – Bottom of range: $342.95 – Top of range: ~$437–$450 – Mid resistance: ~$393–$398 #TSLA may push up → reject → pull back → repeat for several months before a true breakout. * Right now, $TSLA is above key support ($372) but below the breakout pivot (~$393–$398). That means that bullish momentum is active but major resistance is very close. Expect volatility and possible pullbacks, especially if rejected near $398. * Watch the full $TSLA Trading Plan for May 1, 2026 in this short video🔽

Wicked Stocks

15,749 views • 4 months ago