Video yükleniyor...
Video Yüklenemedi
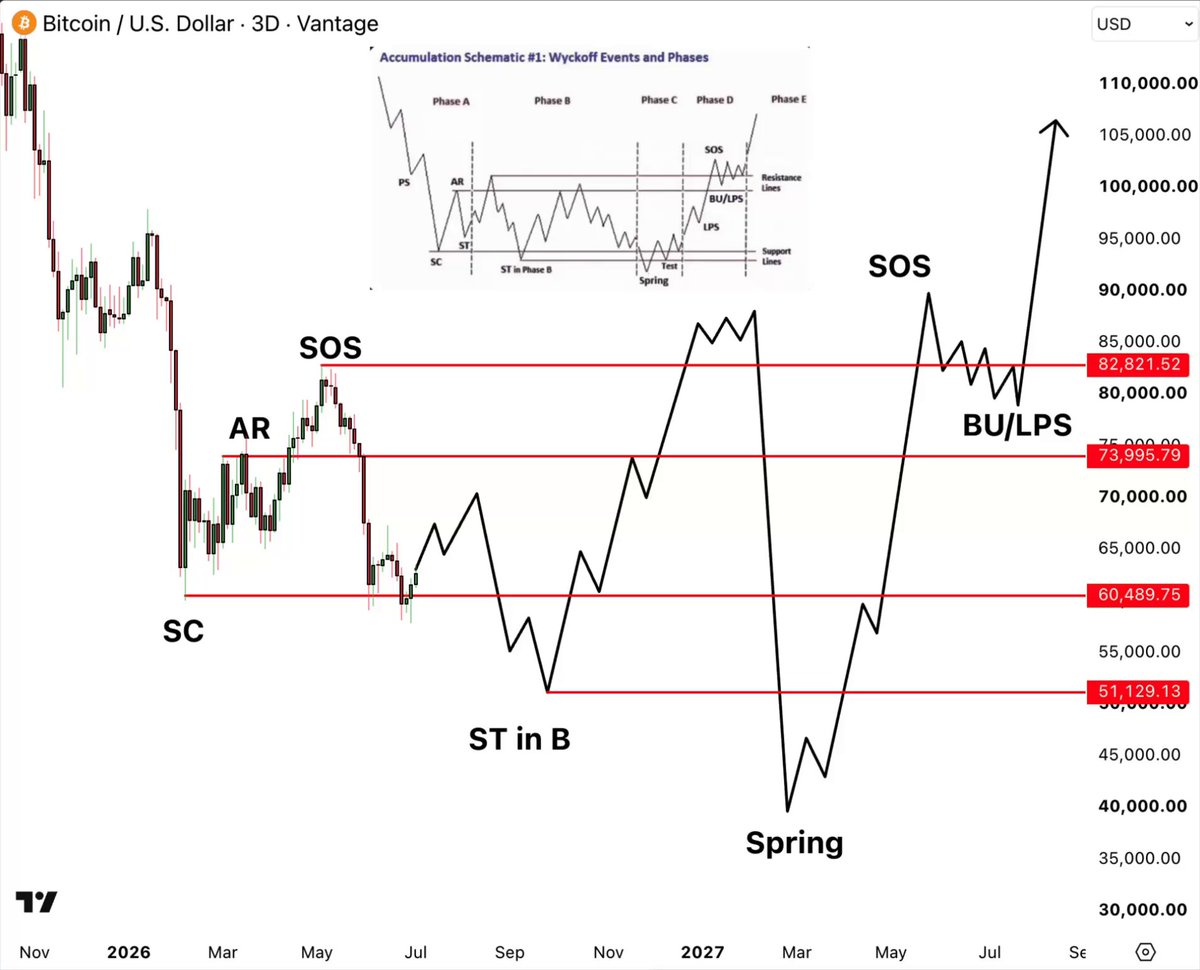
🚨 $BTC'S FINAL DUMP IS LOADING Everyone looks at this chart and sees a dying market I see a textbook Wyckoff Accumulation - Schematic #1. Almost beat for beat Map so far: ➮ Selling Climax at $60K - the capitulation low ➮ Automatic Rally to $76K ➮ Sign of... show more

44,877 görüntüleme • 2 ay önce •via X (Twitter)
13 Yorum

My TG with trading analysis:

Do you think it could reach $100K+?

Phase B chop is where most traders get bored and trade away their portfolio. Stacking daily yield on @Nexo keeps me totally patient so I can just sit back and let the Wyckoff schematic play out without overtrading.

Träum weiter :)

💎👀

Lol not work your chart

Wyckoff setups are fascinating because the biggest moves often come after maximum uncertainty. @0xAralez

차트 해석 방식은 정말 다양해서 흥미로운 것 같아요ㅎㅎ 같은 움직임도 어떤 관점으로 보느냐에 따라 전혀 다른 시나리오가 나올 수 있죠. 저는 패턴뿐만 아니라 실제 거래량과 시장 참여자들의 심리 변화도 함께 보는 편입니다 😊

Wyckoff springs get retail every single time. If we hit that final max pain flush, I am using my @Nexo credit line to buy cheap $BTC using existing collateral, that way I capture the 100k run without risking my spot stack.

If a Spring flush under 50k is really coming, sitting in stables on @Nexo earning daily compound interest is the move. Collect solid yield during the Phase B chop then deploy your dry powder right when max pain hits.

I think we’ll be around $38k end of year

🐝

👀