Loading video...
Video Failed to Load
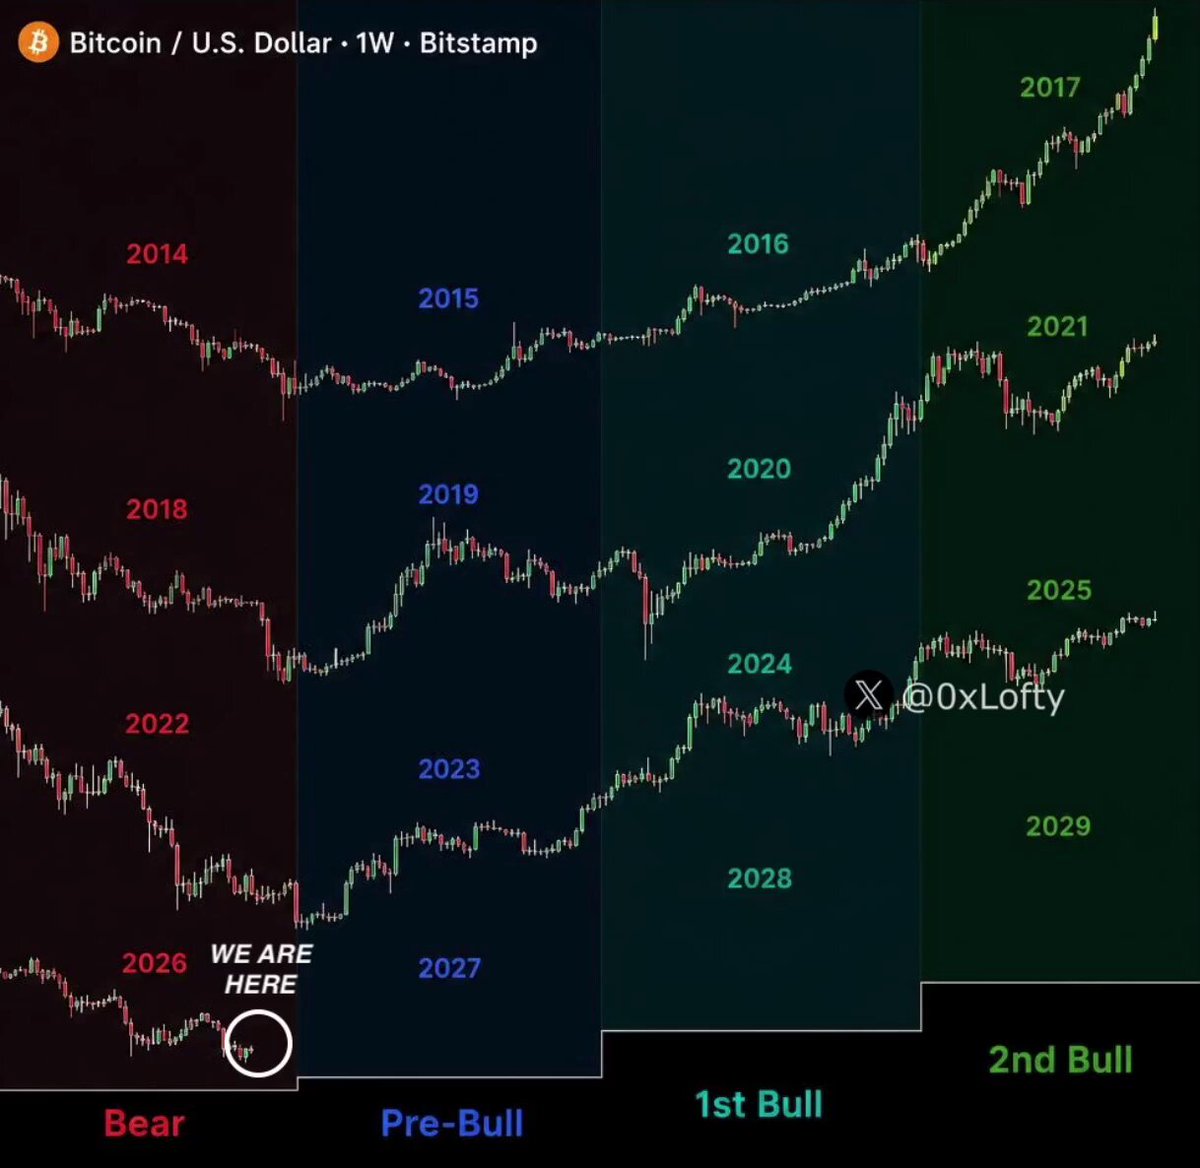
$BTC This Bitcoin chart has never been wrong. This pattern works pretty simply: Bear cycle - 365 days Bull cycle - 1064 days Based on data, bear phase is about 75% complete. One final shakeout before the next bull cycle. Quick reminder: I called Bitcoin’s 2022 bottom and the... show more

166,059 views • 3 months ago •via X (Twitter)
18 Comments

Could it be wrong times time abound?

Yeah, that scenario works—we're waiting for 40k, brothers.

You guys all really use the same wording template huh.

invalidation levels matter more than perfect symmetry

Katılıyorum, veri onayını veriyor: $BTC SHORT: RSI 55, EMA boğa dizilimi, MACD aşağı kesim, skor 54/100. $58,536 destek, $62,282 direnç. Uzun vade ayı, kısa vade nötr → eğilim short; destek kırılırsa devam. #Bitcoin

Based on current data, the bear phase is nearing its end, with about three-quarters of it already played out, suggesting that a final shakeout might occur just before the next significant upward movement.

Bold call. Let's see if that final shakeout plays out.

ngl Sounds like you're just trying to scare weak hands into selling again 👀

Btc will become 170k $ if this realy i will be rich 😂😂😂😂

hey man like how do you even start spotting these crazy patterns before everyone else does?

ready for that final dump before we moon?

Every cycle feels “mathematically perfect” until liquidity breaks the model assumptions.

The 365/1064 cycle math is a decent baseline, but relying too heavily on historical duration often ignores how the liquidity landscape has fundamentally evolved. Markets love to bait everyone with a "final shakeout" before doing something completely unexpected, so I’m keeping a close eye on the order flow rather than just date-based assumptions. Let the price action at these key levels dictate the move, not just the calendar. 📈

365 and 1064 days sounds clean, but cycles don't run on a clock. What if this shakeout is just the start of something longer?

$BTC ready for up trend

Nope thia was before EtF ERA

Volatility creates opportunity

Fact-check on the recent @crypto_lens_ post about BTC cycles: Historical facts check out - BTC hit ~$16K low in Nov 2022 and ~$126K ATH in early Oct 2025. The account has publicly referenced these calls before. Current price (July 3, 2026) is ~$61,500 after recent volatility around the $58K-$62K range. The popular 365-day bear / 1,064-day bull cycle theory roughly fits the timeline so far. However, the short-term targets ($52K-$48K next week, $43K-$38K by August) and claims that the chart "has never been wrong" are not yet supported by data and overstate certainty. Cycle patterns are interesting but approximate - markets evolve with ETFs and new factors. NFA. Always DYOR. Sources: - BTC price history: - 2025 ATH confirmation: CoinMarketCap historical data - Recent price context: Multiple market reports