Video wird geladen...
Video konnte nicht geladen werden
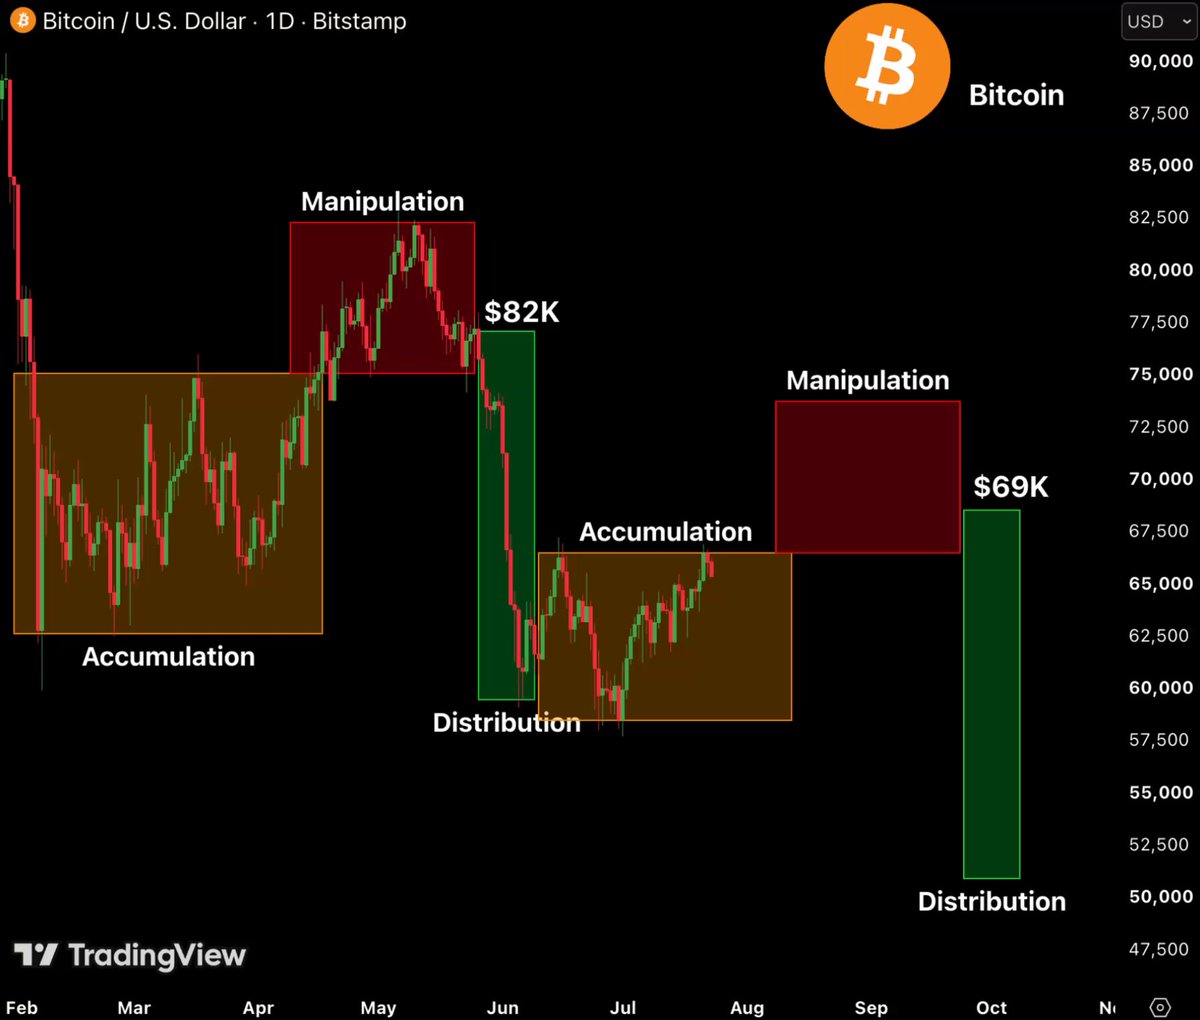
$ETH is following the same accumulation-to-bottom structure again. Distribution → breakdown → re-accumulation → final flush toward ~$1300. in the next 14 days. The last phase traps everyone. Be early or be exit liquidity.

15,189 Aufrufe • vor 6 Monaten •via X (Twitter)
11 Kommentare

Interesting map. $1,300 needs confirmation from a clean breakdown, not just pattern similarity.

Good analysis — BUT! For now, nothing suggests a break in the upward trend — but a reversal to short is possible around 2600, and then we'll need to assess market sentiment.

1300 in 14 days. lmao

Bro, just invest and relax. Timing the market is the biggest mistake. If you believe in the technology and potential of $eth just buy, stake and check back in 10 yrs. Just DCA when the opportunity present itself.

keep nimble or get stuck

Solid macro read. On the 4H, EMA 200 at $2,258 is the first liquidity target before any deeper move. Structure needs to clear that level first. Watching closely.

Traps are where the best entries live. Ready

Still not dropped why?

#grok is this true

interesting, could see that $1300 mark soon enough

interesting
Ähnliche Videos




Sensitive content
🚨 WARNING: THE FINAL BITCOIN DUMP STARTS NEXT WEEK August → Market Bottom September → Accumulation October → Breakout November → Euphoria December → Market Top January → Distribution February → Bull Trap March → Panic April → Capitulation Quick reminder: I publicly called the $17K Bitcoin bottom in 2022. Then I publicly called the $126K top in 2025. The next call will be posted here first. Follow and turn notifications on. Don't become exit liquidity.
Lofty
99,124 Aufrufe • vor 3 Monaten


