正在加载视频...

视频加载失败

🚨 EVERNORTH’S $XRPN EXPLODES +42% PAST $23 — Just DAYS Before The OFFICIAL Nasdaq LAUNCH 😳🔥 Okay… yesterday I was watching $17 → $20. Today $XRPN absolutely DESTROYED both levels. ✅ It closed at $23.36, with the 4H candle even touching roughly $24. 🤯 👉 HOLD → $24 gets...

79,069 次观看 • 13 天前 •via X (Twitter)

0 条评论

暂无评论

原始帖子的评论将显示在这里

相关视频

🚨UPDATE: $XRP SMASHES Through $1.30 and Nearly Hits $1.45 — Now $1.40 Is the FINAL BATTLE Before Another Potential Expansion 👀🔥 $XRP has OFFICIALLY cleared the $1.293–$1.302 resistance zone we were watching — and the reaction was VIOLENT. ✅ Price exploded through $1.30, accelerated above $1.40, and wicked to roughly $1.43–$1.44 before sellers finally stepped in. 🚀 Now $XRP is trading around $1.37, making the $1.40 area the immediate battlefield. 📈 And technically, this move is HUGE: 👉 $1.08 → BROKEN 👉 $1.145 → BROKEN 👉 $1.20 → BROKEN 👉 $1.30 → BROKEN 👉 $1.40 → NOW BEING TESTED The previous resistance ladder has been getting destroyed one level at a time. 🤯 🟢 BULL CASE: Reclaim and HOLD $1.40–$1.45 → price enters another potential expansion phase, with $1.50 becoming the next psychological target before the market starts searching for higher resistance. 🔴 COOLDOWN CASE: Rejection around $1.40–$1.45 → watch $1.30 closely. A successful retest there would turn the previous major resistance into support and keep the broader breakout structure intact. But there is one MASSIVE warning. ⚠️ 🚨 4H RSI is still above 80. $XRP remains EXTREMELY OVERBOUGHT, meaning momentum is enormous — but so is the risk of violent pullbacks. XRP WAS FIGHTING TO HOLD $1 JUST DAYS AGO. NOW IT’S FIGHTING $1.40. 🔥 HOLD $1.30. RECLAIM $1.40–$1.45. THEN THE NEXT LEG GETS VERY INTERESTING.

Diana

35,231 次观看 • 1 个月前

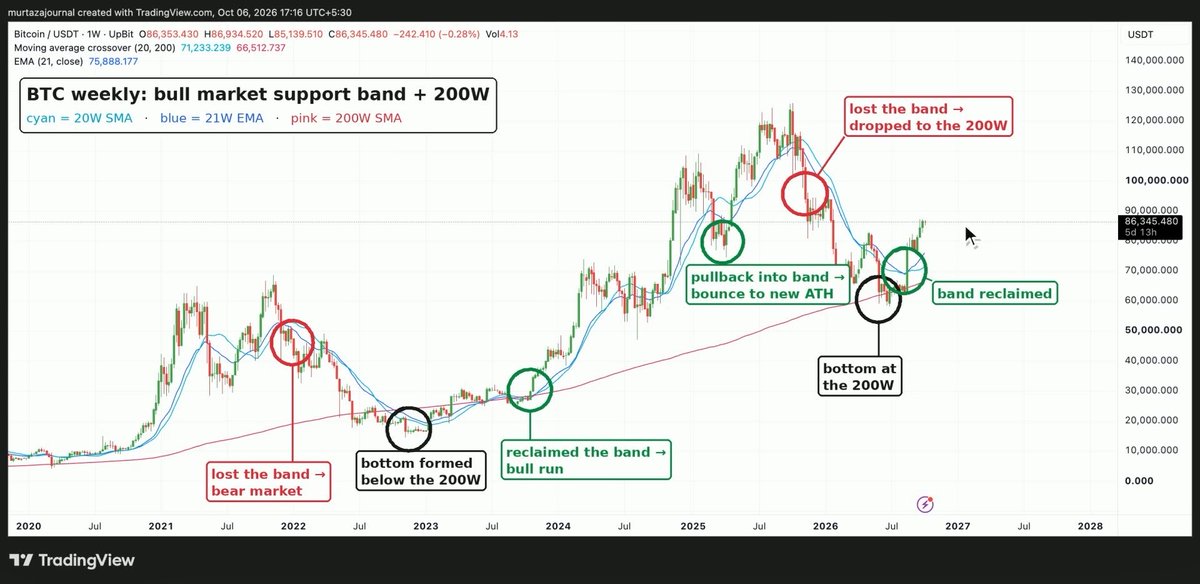
free alpha most people use moving averages wrong. wrong MA, wrong timeframe. here's which ones actually matter and the one setup i trust more than any cross, save this 👇 🔹 which MAs matter EMA = faster, better for trends SMA = slower, cleaner for big levels day trading (5m–1H) 9/21 EMA = momentum 20/50 EMA on the 1H = intraday trend swing trading (4H) 20/50 EMA = swing trend 200 EMA = swing bull/bear line daily 20 EMA = short term momentum 50 SMA = medium term trend 200 SMA = the bull/bear line. one of the most watched MAs in all of markets weekly 20W SMA + 21W EMA = bull market support band 50W SMA = macro trend 200W SMA = cycle bottom zone. $BTC bottoms have historically formed near or below it higher timeframe = more weight 🔸 first: is market trending? rising 200 + higher highs and higher lows = MAs become useful flat 200 + price chopping through it = i ignore MA signals MAs work in trends, not in chop 🔸 the setup i trust the most: fresh 200 the first time price comes back to an untested 200 MA after a trend starts, it tends to react best here but MAs alone aren’t enough. i want a clear trend, confluence with structure and price actually holding up repeated taps usually weaken the level and make a break more likely 🔸 4H trend simplest strategy i use in a bull market: above a rising 4H 200 = i favor longs below a falling 4H 200 = i favor shorts pullback, retest, hold = entry lose it and retest from below = one of the cleanest alt shorts 🔸 when it's late price stretched far above every MA = i'm kinda late i wait for price to cool off first, either a pullback or going sideways while MAs catch up 🔸 bull market support band 20W SMA + 21W EMA on $BTC, most useful setup in crypto $BTC holds above it in bull markets and bounces off it on pullbacks lose it on a weekly close = trend is getting weaker right now: $BTC at ~$86K, back above the band (20W ~$71K / 21W ~$76K). 200W at ~$66.5K 🔸 golden cross / death cross 🟢 golden cross = 50 SMA crosses above 200 SMA 🔴 death cross = 50 SMA crosses below 200 SMA both lag but still useful death crosses in bull markets often come near local bottoms so i use them as confirmation, never as an entry on their own cross works on every timeframe. what changes is how long it lasts 1. long term: 50/200 daily 2. swing: 50/200 on the 4H, or 20/50 daily 3. day trading: 9/21 EMA on 5m–15m, or 20/50 EMA on 1H lower timeframe = more crosses, more fakeouts, shorter moves filter that saves me from most fakeouts: i only take crosses in the direction of the htf 4H golden cross + price above a rising daily 200 = aligned, i look for an entry 4H golden cross + price below a falling daily 200 = countertrend, probably a trap 🔸 how i actually use MAs 1. price above a rising MA = trend up. below a falling MA = trend down 2. slope matters more than the cross. flat MA = no trend 3. reclaim + retest = entry. close back below + rejected retest = failed reclaim, i'm out 4. best levels are where MAs line up with VWAP or horizontal support/resistance 5. wicks don’t count, only actual candle close 🔸 for alts MAs work worse on low liquidity alts. fake breaks everywhere i check $BTC and $OTHERS against daily 200 and the bull market support band first if the market isn't trending, alts usually won't hold their MAs either 🔸 my cheat sheet, screenshot this trend: 200D SMA bull market health: $BTC 20W/21W band cycle bottom zone: $BTC 200W best entries: first tap of a fresh 200, or reclaim + retest avoid: chop, flat MAs, price stretched above MAs, a 200 tapped 4 times invalidation: close through the level + failed retest MAs don't give me buy/sell signals, they show me the trend and where it's likely to go. nfa

murtaza

20,538 次观看 • 8 天前

THE REAL REASON BITCOIN JUST PUMPED TO $69,700 (and will keep pumping) Everyone is staring at the green Bitcoin candle, but the move started somewhere else entirely, in the US Treasury bond market The Treasury just doubled its long-term bond buyback program old max: $2 billion per operation new max: at least $4 billion targets: the 10 to 20 and 20 to 30 year bonds runs from September 9 through November 4 In plain terms, the Treasury is stepping in to support the market for long-term government debt That matters because when Treasury yields fall, risk assets like Bitcoin get more attractive Right after the announcement the yields dropped 10 year: -6 bps to 4.647% 30 year: -9 bps to 5.196% Then Bitcoin ripped $65,400 at 10:45 AM -> $67,600 at 11:26 AM -> $69,700 at 11:27 AM It gained more than $2,000 in a single minute That candle trapped everyone shorting Bitcoin, their leveraged shorts got liquidated and the forced buying pushed price even higher $1.59 billion in crypto liquidations in 24 hours $746 million in Bitcoin shorts wiped out in that one minute candle The chain was simple Treasury expands buybacks -> long-term yields fall -> Bitcoin pumps -> shorts get liquidated -> forced buying sends it even higher One correction, this is not QE and the Fed did not turn on the printer The Treasury is just buying back existing bonds to add liquidity, and the size is still small next to how much debt the US issues But the timing is the tell, the bond market moved first and Bitcoin followed, then the short squeeze turned it into an explosion Everyone is showing you the candle, almost nobody is talking about what happened right before it September 9 is the date to watch now

Atlas

774,784 次观看 • 1 个月前

NASA ARTEMIS II MISSION UPDATE: DAY 7 The crew and the Orion spacecraft are approximately 57,157 km (35,518 mi) from the Moon. They are also about 380,631 km (236,512 mi) from Earth and are traveling at around 2,029 km/h (1,261 mph). The mission is currently 62.3% completed. Yesterday was a very big day for the mission as this culminated in the Lunar Flyby, which included the closest approach to the Moon at a distance of 4,067 km (6,545 mi), occurring at 11:02 UTC (MET+5/00:25). Following this, a record was set for the furthest distance humans had ever traveled from Earth, at a distance of 406,771 km (252,756 mi), which occurred at 23:02 UTC (MET+5/00:27). The crew also witnessed an Earthrise and solar eclipse during this time, before the lunar observation period concluded. Moving on to today's expected events, first up we have the crew wakeup, which is expected to occur at 15:35 UTC (MET+5/17:00). Following this, Orion will exit the lunar sphere of influence, which is expected to occur at 17:25 UTC (MET+5/18:50). Then, after that, will be the Crew Daily Planning Conference (PDC), which will occur at 18:05 UTC (MET+5/19:30). Moving on to the next event after that is PAO: Orion to ISS crew call (audio only), which is expected to happen at 18:40 UTC (MET+5/20:05). Then, following that, will be the Post Lunar flyby science debrief, which will occur at 19:00 UTC (MET+5/20:25). This will then be followed by a crew off-duty period that will start at 19:30 UTC (MET+5/20:55) and will last until 22:20 UTC (MET+5/23:45). Then, after that, will be the Return Trajectory Correction burn #1 (if needed) at 01:03 UTC (MET+6/02:28). And following that will be crew pre sleep at 04:35 UTC (MET+6/06:00), followed by the sleep period at 07:05 UTC (MET+6/08:30). And don't forget, you can tune into our Artemis II Real-Time Tracking 24/7 stream to watch the rest of the mission! NSF Artemis II Real Time Tracking 24/7 | NSF - NASASpaceflight.com

Jake (Max-Q) 🏴󠁧󠁢󠁷󠁬󠁳󠁿

23,025 次观看 • 6 个月前

THE MEME SIDE OF MY GROK BOT MADE $2,014 TODAY. THE PREDICTION SIDE MADE $297. SAME BOT, SAME AFTERNOON the account was $89 five days ago and closed at $4,339.39 this morning. the split is the whole story most people point a bot at one market and let it guess. a bot with one input is a chatbot with a wallet. mine runs five parts, in this order: → TRENCH. Robinhood Chain memecoins, the main engine now. $1,224.63 went in this morning and came back as $3,239.11. four positions opened, three closed while the chart still looked healthy → MAP. a free open source world map, zero API keys, running on my own machine. conflicts, shipping lanes, cables, weather, all live. attention lands there hours before it lands on a chart → RESEARCH. before a dollar moves it checks the story against primary sources. nineteen launches got skipped today on that check or the liquidity filter → ODDS. prediction markets are the slow side now. seven books, all closed today, $803.12 came back as $1,100.27 → EXIT. one rule closes everything: six hour volume under 20% of the 24 hour average. no discretion, no averaging down the exit rule is the part nobody copies, and the only reason the meme side is not a donation every launch dies eventually. the only question is whether you are still holding when the volume goes TRENCH → MAP → RESEARCH → ODDS → EXIT. everyone else is still typing one off prompts and wondering why nothing compounds Bookmark this before your next entry the map is open source and runs with zero API keys. say the word in the replies and I will send the link

savip.

51,859 次观看 • 1 个月前

This is getting seriously interesting. $BTC pumped from $75,500 to $81,200 this morning liquidating $793M in the past 24 hours! But here’s the important part: Yesterday, I said that a clean break above $80,000 would favour continuation higher. That’s exactly what happened. Bitcoin broke straight through $80,000 and pushed towards $81,200 before cooling off. The Bullish structure is still playing out exactly as I wanted, but $80,000 now needs to start acting as support rather than resistance for further upside. Bitcoin now has roughly $2B liquidity above between $81,000 - $83,000 and $4.9B below between $73,000 - $78,500. This means that once again the bigger HTF liquidity imbalance below just got bigger, so a deeper pullback remains the main risk if momentum starts weakening. On the LTF, the largest liquidity magnets sit at $77,700 below and $81,200 - $81,900 above. This means Bitcoin will likely sweep these levels today. Whales have rebuilt large sell walls around $81,500 - $83,000 while some insanely large bids are now stacking from $74,500 - $78,500 below. This means smart money views the $74,500 - $78,500 zone as maximum value for accumulation and the zone up to $83,000 as the perfect sell/short zone. Meanwhile, OI has cooled from the recent spike, spot volume remains very strong, futures buying has improved and Coinbase Premium is much healthier than it was last week. This effectively means leverage has cooled down slightly while spot demand is still supporting the move higher - exactly what you'd want to see after such a huge pump. So to make things simple for you: - $80K reclaim was Bullish - $77.7K and $81.2K are now the two LTF magnets - $81K - $83K is the next upside liquidity zone - $4.9B below keeps $73K - $78.5K as the bigger HTF risk I’ll post any changes to my positioning and the key levels I’m watching in the free Telegram (link in bio).

CryptoReviewing

163,540 次观看 • 1 个月前