Video wird geladen...
Video konnte nicht geladen werden
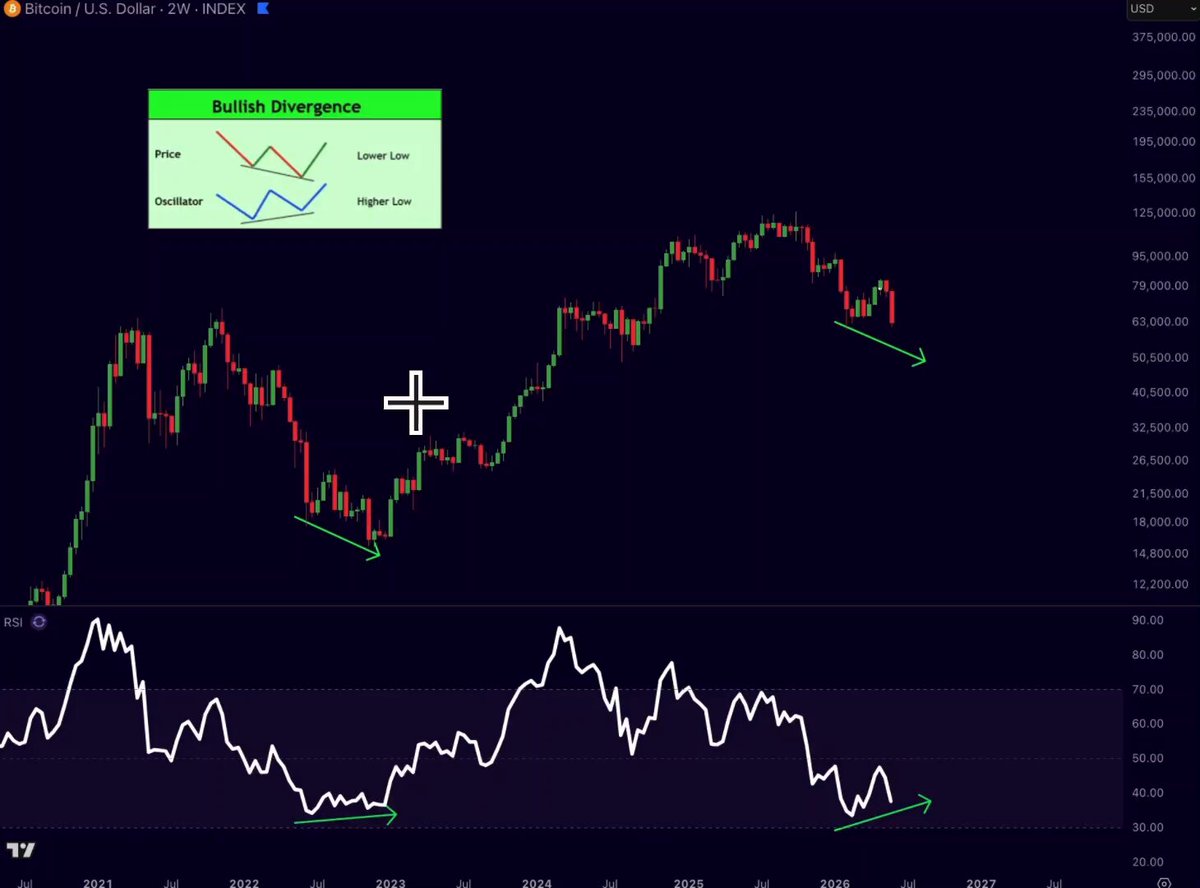
Everybody is sharing the same Bitcoin chart right now... "200-week moving average broke. Here comes another June 2022." But I think that comparison is missing something important. Why are we not also talking about the bullish divergence on the weekly RSI that happened in December 2022 (not June)? Or... show more

32,848 Aufrufe • vor 4 Monaten •via X (Twitter)
32 Kommentare

Nobody was sharing it 9 months ago. Bottom is not in.

Definitely in the camp that we ramp out sooner than people expect.

Doesn’t this permabull shit get old? Doesn’t looking like an idiot, or a grifter, get old? I mean a few months ago you created this tool to show people how to cash out on the way UP…. And it’s been down ever since. Get a grip bro. Come back to reality. Subjective has left chat

Yeah it's missing capitulation event and we will get it. 38k could be Sept-Oct low.

I agree. Opportunity zone has been there for months in spx6900

In any of your previous Scenarios did u saw Ada in 0.14 cents , be honest?

This guy is always wrong, so expect continued dump.

The Bitcoin chart looks like 💩

Have you looked into DMT-NAT on Ethereum? Helps secure bitcoin, interesting project.

It’s so funny how all the YouTube accounts are talking about bull div @dangambardello 😂 You do realize it’s absolutely meaningless without confluence from PA, volume and other indicators, correct? Literally just catching a falling knife at this point. $BTC Chart is terrible.

Yeah you know better

I have a doubt... thought when btc.d went down we alts were going up, but so far btc.d going up or down, and we alts always going down

Not talkinf about it coz bullish divergence means fuck all unless it's confirmed with a higher high.

The schedule is not working right now, this month is so accurate

$DOG is bleeding hard

I think it's pretty clear at this point that the current cycle isn't following any previous cycles. We are in undiscovered territory.

All the noise about coins that store value or move money (really, they all do), however, we need to start looking at coins that can also compute and store on chain data. I built on CaffeineAI hosted on no other than ICP.

Does data drive bitcoin bull/bear markets?

narrative lag always misses the divergence

Everyone seems to be sharing the same Bitcoin chart right now: "The 200-week moving average has broken. Here comes another June 2022." But that comparison leaves out some important context. Why aren't we also discussing the weekly RSI bullish divergence that appeared in late 2022 before the market recovered? Or the fact that many altcoins showed signs of bottoming before Bitcoin fully turned around? No two market cycles are identical. It's easy to find a chart pattern that supports a bearish or bullish view, but relying on a single historical fractal rarely tells the whole story. The better approach is to combine multiple signals—price action, market structure, liquidity, macroeconomic conditions, and on-chain data—rather than focusing on one indicator in isolation. Nobody knows with certainty what happens next. But if history teaches us anything, it's that periods of maximum uncertainty have often been where long-term opportunities were created. Stay patient, stay objective, and let data,not emotions,guide your decisions.

Monthly 50 ma is key close today

Good to mention: long term holders are increasing fast. 16,5M and counting.

Market's often fixated on the obvious. Divergences can be noise or signal. Context always matters more than headlines. History rhymes, but never

Cycle narratives are lazy. Price action doesn’t repeat it rhymes.

I think 1 more month of pain then recovery. However its not important if I'm right or wrong because bitcoin will recover, thats indisputable imo.

Some very compelling points mentioned. Thnx Dan!
300 week MA gets tagged?

$DOG

crowd trades the headline, not the chart

Crypto president!!!!!

Your videos are fire bro, god bless you Dan , love em

Cherry picking any fractal ends badly