正在加载视频...
视频加载失败
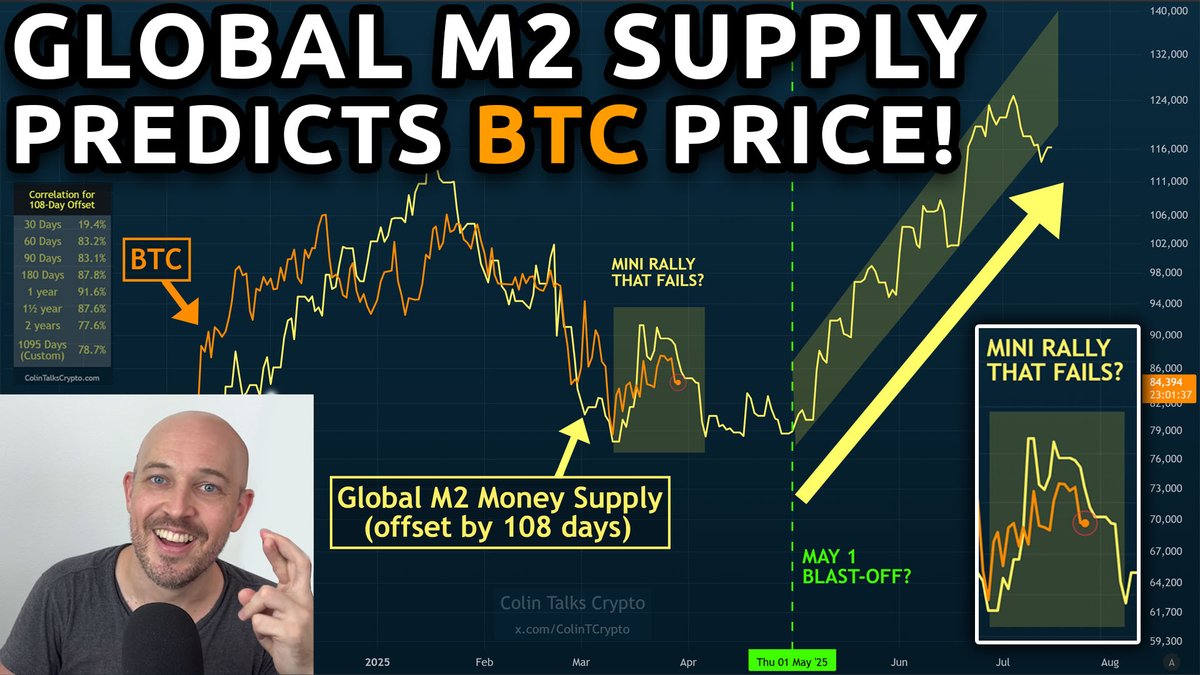
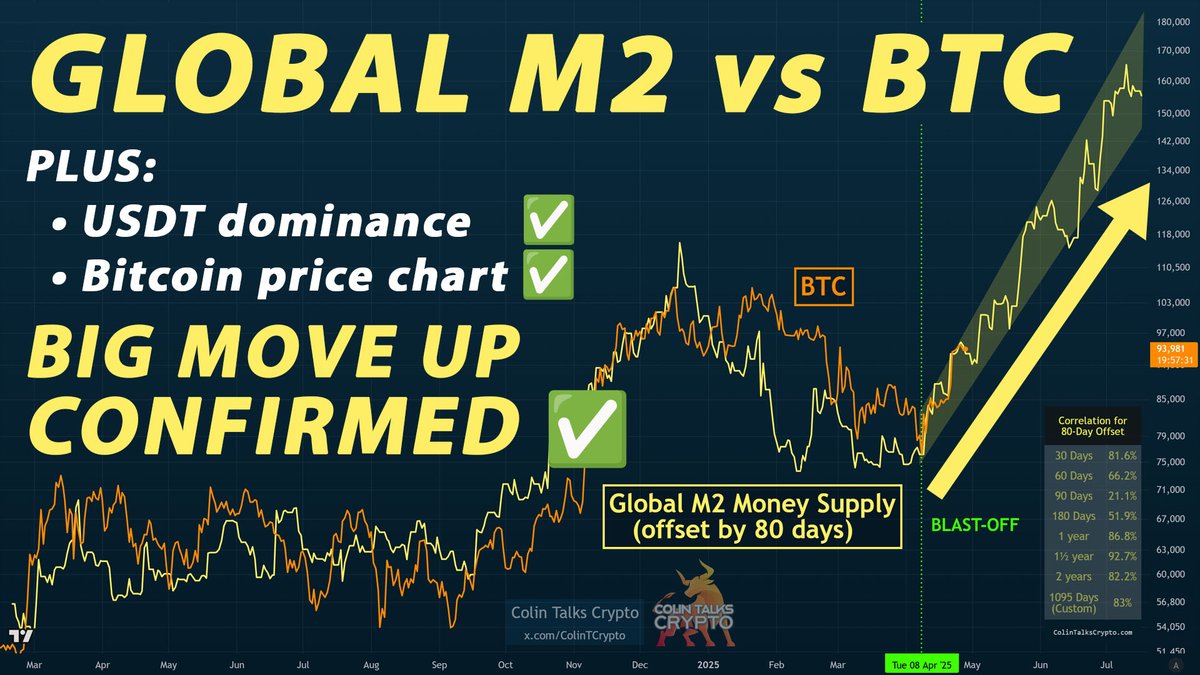
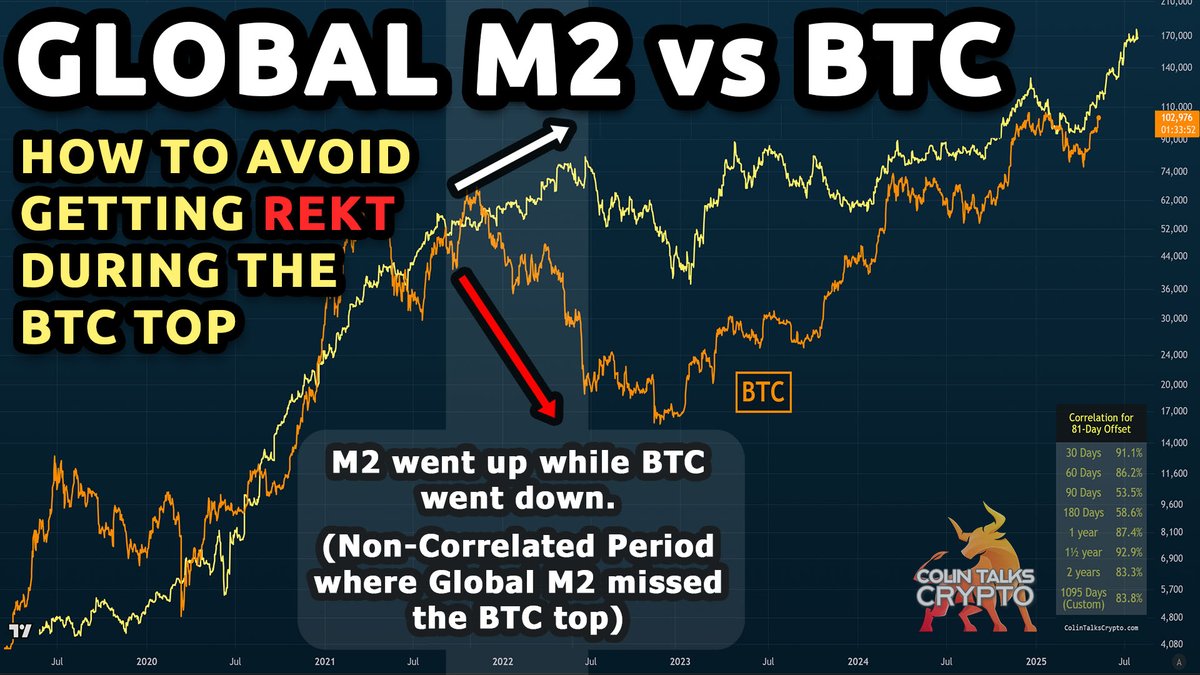
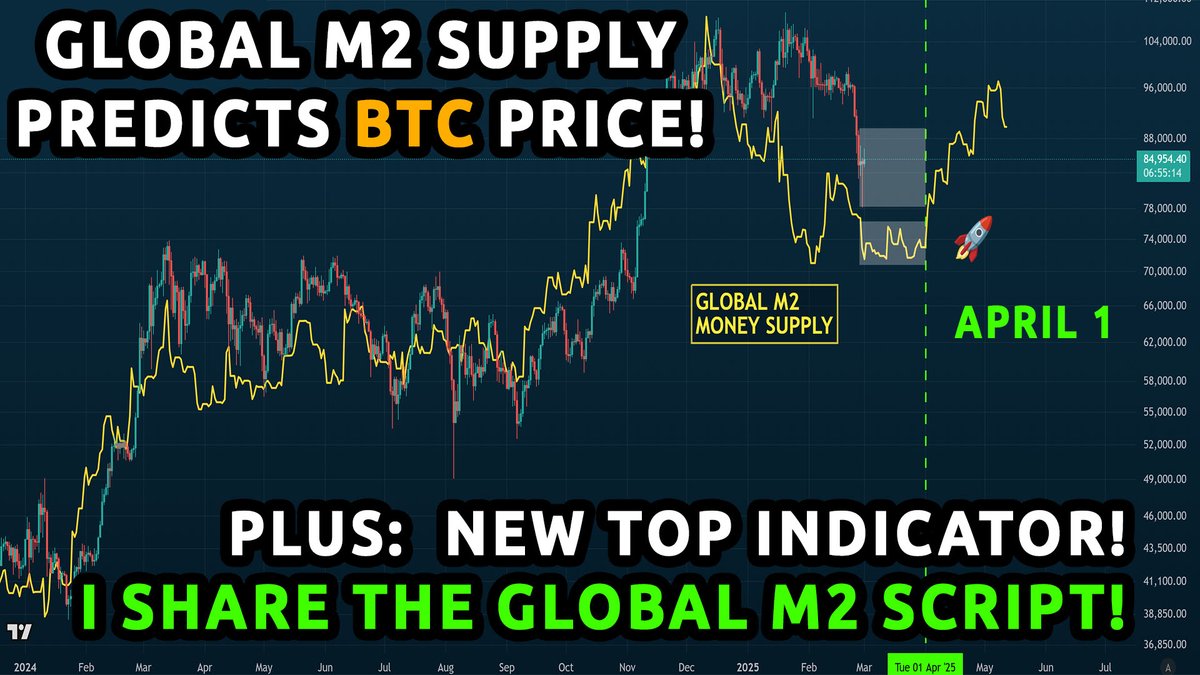
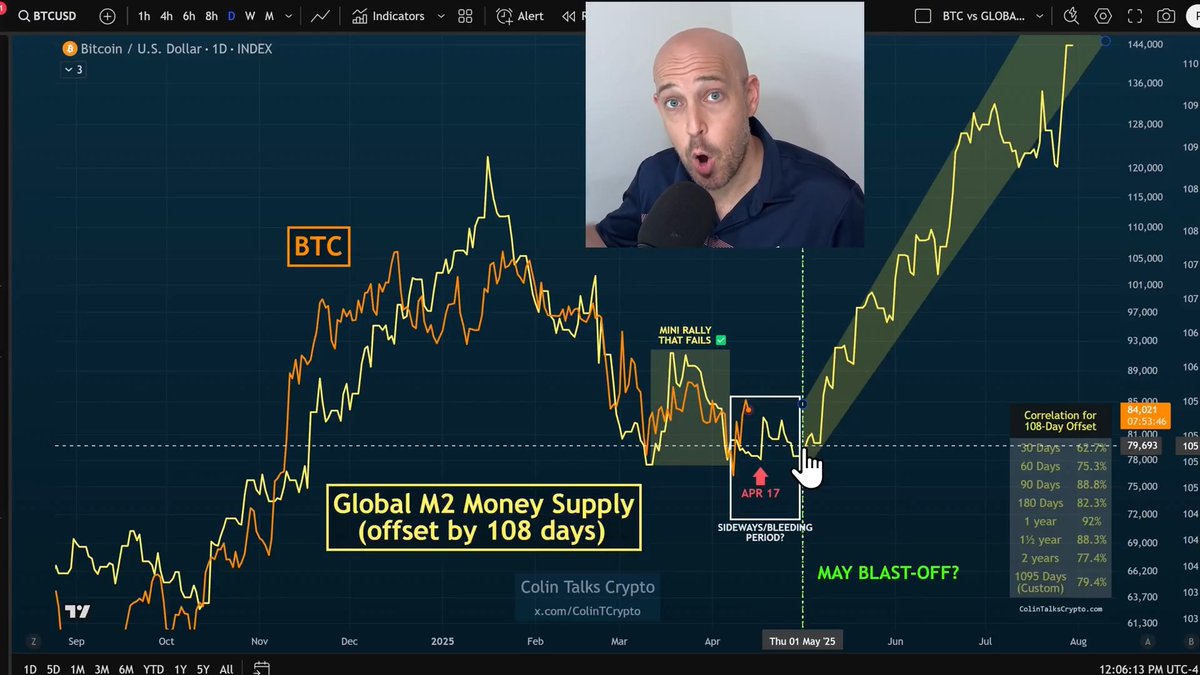
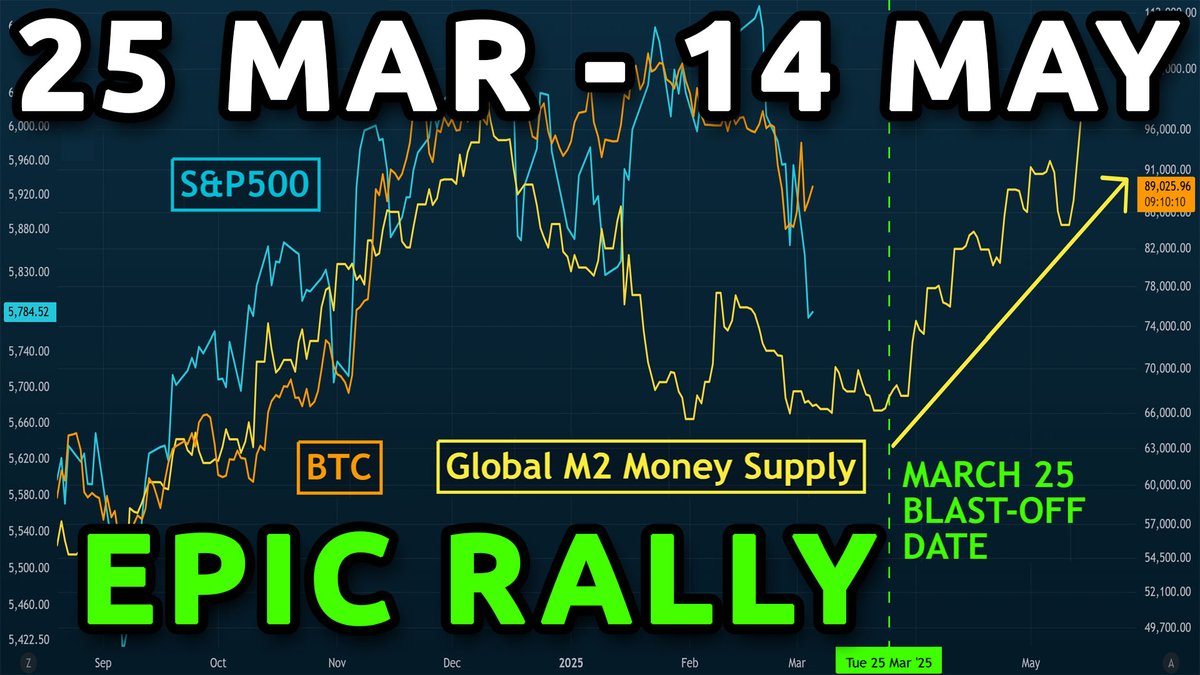
Global M2 Money Supply predicts Bitcoin's next move. We find which offset is best! Get the M2 script for TradingView here:

11 条评论

YouTube link (4k):
Thank you again, @MarnyMarek, for the M2 vs BTC correlation charts referenced in the video! He made these charts:

Stay ahead in crypto trading with fast access to pricing, order books, and trade data from trusted exchanges and marketplaces. No waiting, no demos—just seamless access to the insights you need to succeed.

I liked March 25th much better 🤣

Take a poll for the offset .... would be interesting to see the result from the "hive mind"

One thought about this, since crypto markets tend to change direction usually around the 6th of each month (+-1/2 days), I would search around 6th of april or may. Therefore, I don't fully trust the april 30th as a hard date

Mate you got 30th of april on there with a 10 week lead. Mate what are you doing its out of wack, its top now Is about mid may, so thats not 10 weeks for 30th april and the start os not another 45 days away as that puts it 90+ days. Mate your all Over the place

the earlier one makes sense more than the later one. Usually alt coin pairs bottom when quantitative tightening ends. For that to happen we would need to see a significant dump before mid year and that cannot happen with bitcoin pumping it needs to crash abit

There are fresh new uncertainties brought up by Trump, so the blast off date might be distorted. But the trend won't change. Excellent analysis! Thanks!

Hope so cause we likely get an answer soon Lose the 50 week (75K) its probably over Blood moon the next 2 days

I agree that a 105 day shift fits the BTC chart better, however if you copy the M2 indicator onto the USDT.D log chart, 75 days matches a lot better in my opinion, check it out! Anyways, cheers for the videos colin.