Video yükleniyor...

Video Yüklenemedi

Ana Sayfaya Dön

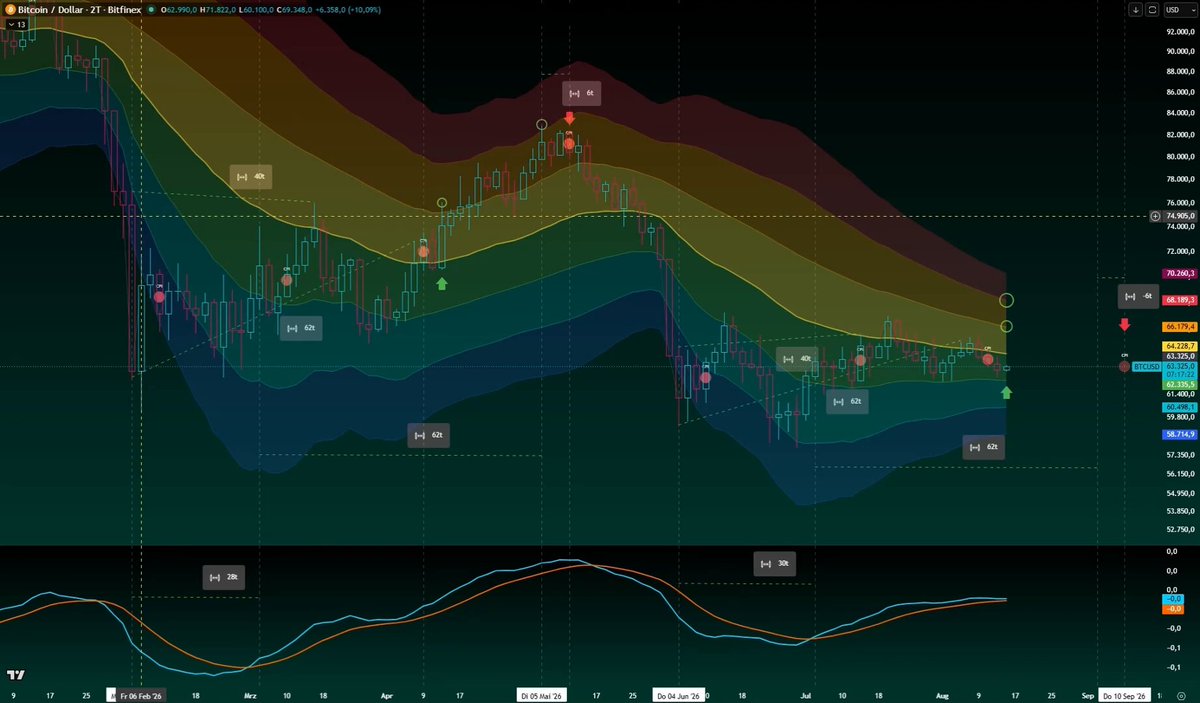
I decided to update this video for you by showing the timeframes when Bitcoin pumped in 2023 and when it reached its peak price. Bitcoin is currently behaving in exactly the same way. The pattern is very similar and has repeated itself perfectly so far. If the rest of...

38,573 görüntüleme • 1 ay önce •via X (Twitter)

42 Yorum

XAPA profil fotoğrafı
XAPA1 ay önce

Bitcoin could face rejection around the $83,200 level, if the pattern repeats within the exact same timeframe, this would have to happen by Friday.

Eddy Ge profil fotoğrafı
Eddy Ge1 ay önce

Nice

At the Bitcoin Frontier 🦅 profil fotoğrafı
At the Bitcoin Frontier 🦅1 ay önce

How accurate! Awesome work, buddy

XAPA profil fotoğrafı
XAPA1 ay önce

thank you so much :-)

Zimby profil fotoğrafı
Zimby1 ay önce

Semoga sama 😊

Niclas Fechter profil fotoğrafı
Niclas Fechter1 ay önce

🫱🏼‍🫲🏽

AdemmV2 profil fotoğrafı
AdemmV21 ay önce

bruder du bist so krass

Musti profil fotoğrafı
Musti1 ay önce

🔥🔥🔥🔥

LeFrog James profil fotoğrafı
LeFrog James1 ay önce

Let’s see how it plays out📈

XAPA profil fotoğrafı
XAPA1 ay önce

👀

Pro Pro profil fotoğrafı
Pro Pro1 ay önce

💯🔥

patrick profil fotoğrafı
patrick1 ay önce

warum sind die Videos immer ohne Ton?

XAPA profil fotoğrafı
XAPA1 ay önce

You don't need sound to understand that video, read the description

Ayano profil fotoğrafı
Ayano1 ay önce

Thanks XAPA ❤️

xnico profil fotoğrafı
xnico1 ay önce

Good staff !

steviewonder profil fotoğrafı
steviewonder1 ay önce

🔥 🔥 🔥

XAPA profil fotoğrafı
XAPA1 ay önce

thank's for your support

Yunus Ruffy profil fotoğrafı
Yunus Ruffy1 ay önce

Goat

Redmund Rillington profil fotoğrafı
Redmund Rillington1 ay önce

Thanks :)

XAPA profil fotoğrafı
XAPA1 ay önce

i appreciate your support here

Firox profil fotoğrafı
Firox1 ay önce

👑

Maczkus profil fotoğrafı
Maczkus1 ay önce

as always spot on

XAPA profil fotoğrafı
XAPA1 ay önce

🌹

Tobi K. profil fotoğrafı
Tobi K.1 ay önce

Danke 🙏

Don profil fotoğrafı
Don1 ay önce

Ty for sharing

XAPA profil fotoğrafı
XAPA1 ay önce

ty for supporting

Daps profil fotoğrafı
Daps1 ay önce

Alright xapa

XAPA profil fotoğrafı
XAPA1 ay önce

👀

Maximemator profil fotoğrafı
Maximemator1 ay önce

Ich bin bereit 💥

Samuel profil fotoğrafı
Samuel1 ay önce

Hey Xaps, thanks for your videos! 🔥 Can I ask your opinion? Since I expect BTC to rise over the next few years, would you say it’s better to buy whenever you can, or, since it could go either way now, wait before your next investment?

evettezeme2 profil fotoğrafı
evettezeme21 ay önce

Take your flowers🌹🌹🌹

Kirill Seibel profil fotoğrafı
Kirill Seibel1 ay önce

Thank you!

Joel profil fotoğrafı
Joel1 ay önce

Xapa, do you expect another dip in the coming weeks that would allow for further investment?

XAPA profil fotoğrafı
XAPA1 ay önce

Yes, but is it worth sitting on the sidelines, because of 10,000$? 69,000 or 79,000, it makes no big difference if we reach 200,000$.

PRO Gebäudreinigung profil fotoğrafı
PRO Gebäudreinigung1 ay önce

Bro sag auch mal was zur XRP 🙏🏻

Haznen profil fotoğrafı
Haznen1 ay önce

He's cooking!

AtlasOfWisdom profil fotoğrafı
AtlasOfWisdom1 ay önce

Could you analyze the chainlink chart?

XAPA profil fotoğrafı
XAPA1 ay önce

On X i am mostly focused on S&P, BTC & ETH Join our community server for that

AtlasOfWisdom profil fotoğrafı
AtlasOfWisdom1 ay önce

If you post about Ena, post about Link too - it’s more important 🫶🫡

Keintiefschlag profil fotoğrafı
Keintiefschlag1 ay önce

Wie sieht’s aus bezüglich der Fed und den Zinsentscheid am 16.09 ? Wird das unsere Spekulation beeinflussen da es derzeit auf eine negative Entwicklung Spekuliert wird.

XAPA profil fotoğrafı
XAPA1 ay önce

Time will tell.

Lukas profil fotoğrafı
Lukas1 ay önce

What about XRP?

Benzer Videolar

Let’s briefly look back at what actually happened back then, before the breakout was visible, as in the August thread. In 2023, the final bottom formed 147 to 161 days after the wick outside the blue TEM zone. The 161 days are explained by COVID, the FTX crash, and a two-week delay with a price difference of less than 1%. What matters is the time interval itself. It took 245 days to reach the top. The move from the wick outside the blue TEM zone to the top was +43.5%. From the last low, Bitcoin pumped for three weeks, then moved sideways for three weeks, and after that consolidation gained more than +24% within one week. The impulse ended after exactly three weeks with the first sign of weakness and a pullback of -11%. The highest high formed in week six. After that, price dropped -22%. From the end of the three-week sideways phase to the peak, it took 42 days. In 2026, the final bottom formed 147 days after the wick outside the blue TEM zone. It took 231 days to reach the top, without the two-week delay from back then. The move from the wick outside the blue TEM zone to the top is +45.5%. Here as well, Bitcoin pumped for three weeks from the last low, then moved sideways for three weeks, and after that consolidation gained more than +24% within one week. After exactly three weeks came the first sign of weakness and a pullback of -9%. The highest high formed again in week six and therefore lines up with the current week. From the end of the three-week sideways phase to the peak, it again took 42 days. A final upside impulse is possible and cannot be ruled out. If the structure repeats 1:1, the local top is already in. The key levels are the 50-week EMA/SMA . If Bitcoin finds support there, the path toward $100,000 remains open! If the pattern repeats 1:1, Bitcoin would likely sit around $78–79k next week, then pump into $82/83k. What matters is whether this range holds. The pattern is too precise to dismiss as coincidence. bitcoin:native

XAPA

57,597 görüntüleme • 17 gün önce

I’ve been mapping this HTF pattern onto the LTF for weeks now, with very high precision. Delays can still happen because this is an HTF pattern on the weekly timeframe. After I said Bitcoin would reach the $84,600–$85,600 zone and get rejected there and it played out exactly that way, I want to explain why I thought that and what I expect next. Measured from the number 8 (you see the pattern on the 8H timeframe, but the overall pattern in this video was drawn on the 3D timeframe), one day before the breakout, it took 24–27 days for Bitcoin to find its low. Bitcoin still needed a maximum wick into the orange zone between $84,600 and $85,600. You can see that in 2023 the wick into the orange zone happened, and the next 8-hour candle pumped only 0.41% and got rejected below the orange TEM zone. You can follow the rest of the move in the video. The same scenario played out again today. Exact wick into the orange TEM zone, then the next 8H candle started bullish with a +0.40% pump and got rejected below the orange TEM zone. $85,600 was hit, euphoria kicked into the market, impatience got punished, and late longs are now trapped. If the pattern continues to play out on the LTF with the same high precision, I first expect a drop to $82,300, followed by another drop toward $80,000. If it plays out that way, I expect a wick above the orange zone once again, before it drops further towards the $79,000–$75,000 range. It’s not the time to be bearish. Bitcoin looks extremely strong, the $82,000–$83,000 zone is holding beautifully. I still expect Bitcoin to drop below $80,000, but I’m not betting on it. I’m preparing for the next brutal pump and will start building my swing position. Because the TEM zones move with price and levels can shift, the targets can change as well, I’ll keep posting daily updates. It doesn't necessarily mean it has to happen again! Since this is a high-timeframe (1W) pattern, delays or deviations may occur on lower timeframes than 1W.

XAPA

33,938 görüntüleme • 14 gün önce