Video wird geladen...

Video konnte nicht geladen werden

Zur Startseite

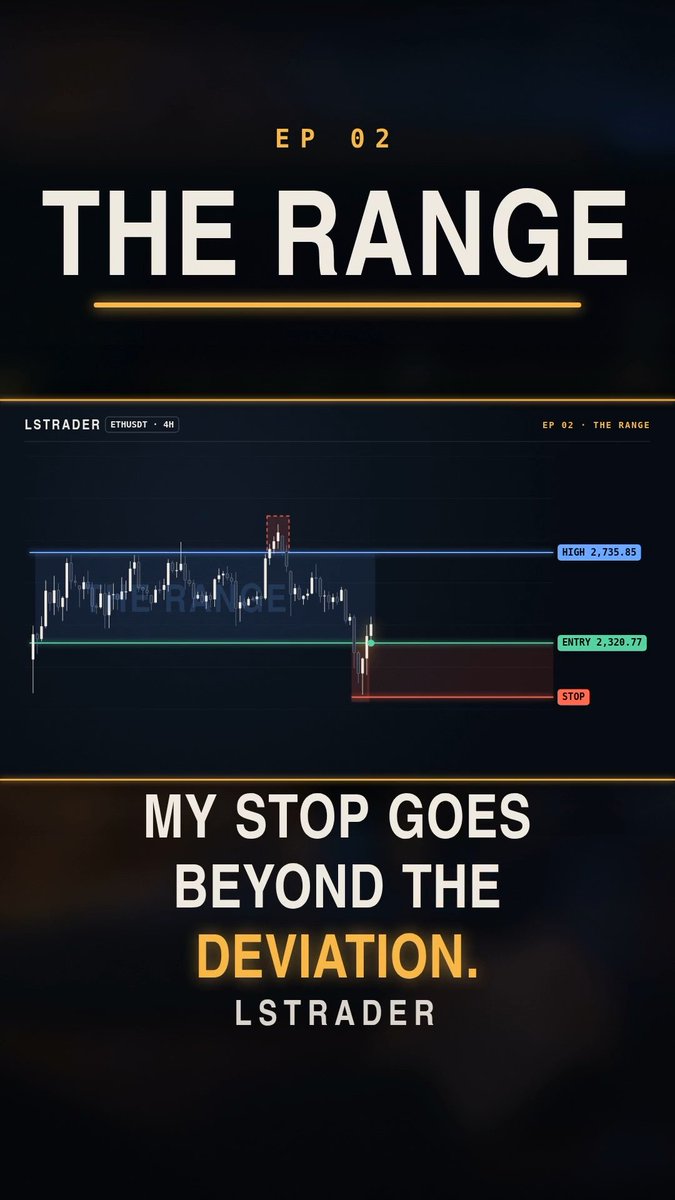
I do not buy range breakouts unless I can align the pivot across multiple timeframes. When I see a full range breakout setting up, I look for a tight pivot on the shorter timeframe inside that larger pattern. That alignment allows me to manage my risk with a much...

32,090 Aufrufe • vor 15 Tagen •via X (Twitter)

6 Kommentare

Profilbild von Madd Pyreight
Madd Pyreightvor 14 Tagen

@TraderLion Inside day lining up with D consolidation pivot within the base after key MA reclaim

Profilbild von Pikachoo
Pikachoovor 15 Tagen

Awesome! i had this question many times. How. do I know a breakout is coming. I noticed the daily ranges have tightening on right side on 30 mins or hourly chart prior to breakout

Profilbild von Pintu Kumar
Pintu Kumarvor 15 Tagen

Solid breakdown. Multi-timeframe pivot alignment is key. You and @shiny_4125 are my go-to for this stuff.

Profilbild von 他叫张三,我叫李四
他叫张三,我叫李四vor 15 Tagen

Love the multi-TF pivot before taking a range break. I'm drilling small-size TSLA day entries (wait ~09:40, skip gap-downs, trail ~1%, no overnight). When the daily is stretched, do you still take the intraday break or wait for a cleaner retest? Just practice, not advice.

Profilbild von David Langley
David Langleyvor 14 Tagen

@TraderLion Aligned pivots across timeframes make range breakouts cleaner. You and @PeterPrunt are my go-to finance accounts.

Profilbild von anestesiópata
anestesiópatavor 15 Tagen

Multi-timeframe pivot alignment is underrated — @mozlyxy covers this kind of confluence well and it clicked for me.

Ähnliche Videos

I’ve been mapping this HTF pattern onto the LTF for weeks now, with very high precision. Delays can still happen because this is an HTF pattern on the weekly timeframe. After I said Bitcoin would reach the $84,600–$85,600 zone and get rejected there and it played out exactly that way, I want to explain why I thought that and what I expect next. Measured from the number 8 (you see the pattern on the 8H timeframe, but the overall pattern in this video was drawn on the 3D timeframe), one day before the breakout, it took 24–27 days for Bitcoin to find its low. Bitcoin still needed a maximum wick into the orange zone between $84,600 and $85,600. You can see that in 2023 the wick into the orange zone happened, and the next 8-hour candle pumped only 0.41% and got rejected below the orange TEM zone. You can follow the rest of the move in the video. The same scenario played out again today. Exact wick into the orange TEM zone, then the next 8H candle started bullish with a +0.40% pump and got rejected below the orange TEM zone. $85,600 was hit, euphoria kicked into the market, impatience got punished, and late longs are now trapped. If the pattern continues to play out on the LTF with the same high precision, I first expect a drop to $82,300, followed by another drop toward $80,000. If it plays out that way, I expect a wick above the orange zone once again, before it drops further towards the $79,000–$75,000 range. It’s not the time to be bearish. Bitcoin looks extremely strong, the $82,000–$83,000 zone is holding beautifully. I still expect Bitcoin to drop below $80,000, but I’m not betting on it. I’m preparing for the next brutal pump and will start building my swing position. Because the TEM zones move with price and levels can shift, the targets can change as well, I’ll keep posting daily updates. It doesn't necessarily mean it has to happen again! Since this is a high-timeframe (1W) pattern, delays or deviations may occur on lower timeframes than 1W.

XAPA

34,422 Aufrufe • vor 1 Monat