Video yükleniyor...

Video Yüklenemedi

Ana Sayfaya Dön

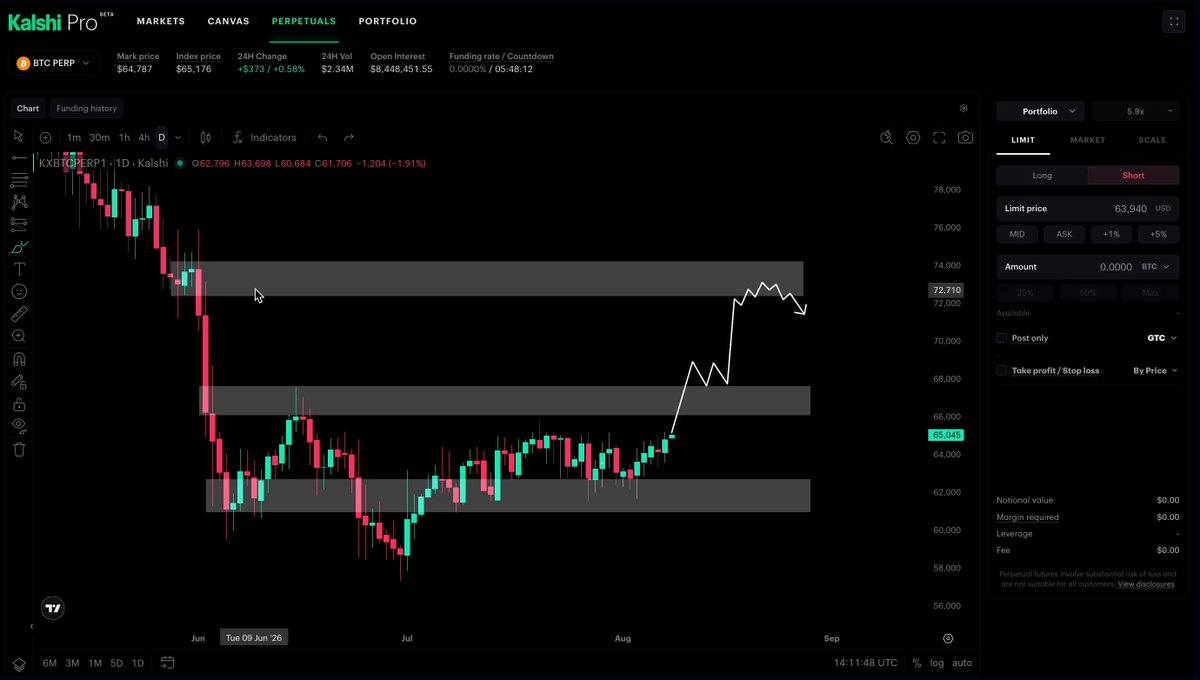
If You’re Buying $BTC Here, Read This First Weekly structure remains bearish. This is not a confirmed bottom, and I’m not buying spot at these levels. Price is trading inside a support band, not a clean level, which means no limit orders. My plan: - Wait for a deviation...

15,537 görüntüleme • 5 ay önce •via X (Twitter)

0 Yorum

Yorum bulunmuyor

Orijinal gönderinin yorumları burada görünecek

Benzer Videolar

📺 $TSLA REMAINS BEARISH — DON’T CHASE THIS BOUNCE #Tesla key breakdown already happened about 5 weeks ago, below $425.88. This flipped the structure bearish in the medium term. Since then, the chart has been working within a descending channel. The primary downside target remains $331.25 (2–3 month objective). This is not a straight drop — the expectation is: range trading → retest → eventual breakdown or base formation. * $TSLA Key Levels: Major Resistance (Ceiling Zones) – $402.36 → near-term weekly high cap – $420s – $425.88 → critical macro resistance – $448.85 → trend reversal trigger (only if reclaimed) Support Levels (Where Buyers Step In) – $390.12 → short-term pivot (intraday control level) – $368.84 → key channel support – $356.54 → major support / 50% retracement – $331.25 → ultimate downside target * #TSLA is now sitting below $390.12 (weak short-term) but above $368.84 (still holding support zone). This is neutral-to-weak positioning inside the range, not a breakdown yet. We expect a range behavior: – Sell zone: ~$402.36 – Buy zone: ~$356.54 – Inside this: $390.12 → controls intraday strength and $368.84 → key support to watch for breakdown This is essentially a range-bound swing market: sell strength → buy weakness → repeat until breakout. * Rejection near $402.36 will push $TSLA lower over 2–3 weeks and test of $356.54. If that breaks → fast move to $331.25. If #TSLA reclaims $390.12, we should see a short-term bounce into $402.36 (weekly high). A stronger rally comes only if it breaks $402.36, with the possible move to the $420–$425.88 area. True reversal happens only if $448.85 is reclaimed. Then momentum flips bullish, with the target of $530+ over several months. * So, $TSLA is not trending cleanly — it’s range-bound inside a bearish structure. The stock is currently stuck between $356–$402, with a likely path of fading rallies and retesting lower levels. Unless #Tesla reclaims $402+ and especially $425.88, rallies are sellable, and the risk of a move toward $331 remains very real. * If you enjoyed this update, please ❤️like and 🔁retweet Watch the full $TSLA Trading Plan for Mar 24, 2026 in this short video🔽

Wicked Stocks

14,331 görüntüleme • 3 ay önce

📺 $TSLA ISN’T DONE FALLING — LOWER PRICE AHEAD #Tesla is in a confirmed longer-term sell signal after breaking below $425.88 about five weeks ago. That breakdown projects a primary downside target of $331.25, expected to be reached within the 2–3-month window (now about halfway through). Despite the bearish trend, $331.25 is seen as a major inflection point to take profits on shorts and go long, with the potential reversal back toward $420+ within a few months. * #TSLA is currently trading inside a bearish descending channel, with momentum still negative. $399.24 is the key short-term pivot level. It acts as immediate resistance, and as long as $TSLA stays below it, bears remain in control. $425.88 is a major resistance (former breakdown level), while $448.85 is a critical breakout level – only above this level can the true bullish reversal be confirmed. Rallies into these zones are sellable until proven otherwise. $367.96 is likely a short-term downside for the next few days. $356.54 is the next major level (50% retracement), which is expected to be hit within 1–2 weeks. * So, the current setup favors selling near $399 with the $356 target. Momentum stays bearish until $399.24 is reclaimed. If $TSLA reclaims $399.24, the bias shifts to short-term bullish. We could expect a move toward $425 and then to $448. However, these levels are still expected to act as resistance, likely fade zones into April–May. #TSLA remains in a sell-the-rally environment. * If you enjoyed this update, please ❤️like and 🔁retweet Watch the full $TSLA Trading Plan for Mar 26, 2026 in this short video🔽

Wicked Stocks

13,116 görüntüleme • 3 ay önce

📺 IF $TSLA BREAKS $367.96 TODAY, $356.54 COMES NEXT #Tesla is in a confirmed longer-term sell signal that started ~6 weeks ago after losing the $425.88 level. The primary downside target remains $331.25, expected within a couple of months' window. We are already well into that timeline, meaning the move IS maturing, NOT just starting. So, this is still a downtrend with unfinished business lower, but we're getting closer to where shorts should think about exiting. * The first major support is $356.54, which represents the 50% retracement level and acts as short-term containment. Good zone for taking profits on shorts and temporary bounces. BUT a close below $356.54 is expected, not unlikely. If it breaks → downside accelerates. * Breakdown trigger is $367.96. It is a near-term pivot (recent low). If #TSLA opens or breaks below $367.96, we should see a fast move toward $356.54. This could happen intraday. * Our final target is $331.25. It is a main “sister formation” target, expected within 1–2 weeks after losing $356.54. This is where shorts fully take profits, a larger bottom may form, which could mark a Q2 low or even a longer-term base. * On the flip side, we have our first resistance at $385.01 (former support). If $TSLA reclaims $385.01, it opens a move to $397.69, our second resistance. Likely short-term ceiling. Even if reached, expect rejection back to $356.54. * Trading Framework: – Bear case (primary) Below $367.96 → $356.54 → $331.25 Trend = down – Bull case (counter-trend) Above $385 → $397 Above $397 → $425 Still likely sellable rallies unless structure changes. * So, this is a mature downtrend, not a fresh one. $356 remains key — break it, and the final leg likely comes fast. $331 is the real target + profit-taking zone. Any bounce before that = tactical, not trend reversal. * If you enjoyed this update, please ❤️like and 🔁retweet Watch the full $TSLA Trading Plan for Mar 27, 2026 in this short video🔽

Wicked Stocks

17,523 görüntüleme • 3 ay önce

📺 $TSLA $500 NEXT OR REVERSAL FIRST? Please ❤️like and share with fellow Tesla traders/investors Tesla ($TSLA#Tesla is sitting right at a critical resistance zone after a strong run: $442.26 to $444.99 (channel top). This is not just any level. This is a decision zone that determines whether #TSLA: – Breaks into a new leg higher (bullish continuation) – Or rejects and rotates lower (range or pullback) * So, the entire bullish thesis hinges on the weekly close above $444.99. If confirmed: – Short-term target (2–3 weeks): ~$498.83 (prior December high) – Medium-term target (2–3 months): ~$541.33 This move could extend through June–July and into Q3. An additional early signal would be a close above $452.34 on Thursday. It would suggest strong momentum and imply a likely continuation into Friday, with an immediate upside projection of ~$474.07 the next day. If the price breaks above the resistance, it likely accelerates quickly—this becomes a momentum trade. * If #TSLA fails to hold above resistance, the tone flips. A key rejection signal is a weekly close below $442.26. Then, the stock likely enters a range ($347 → $442) or a pullback phase, with a possible consolidation lasting 2-3 months. Downside levels: – First support: $426.50. Break below → early weakness signal – Next target: $409.03 – Intermediate level: $387.07 – Deeper downside: $340 s – $350 s Failure at resistance = no trend, just chop or pullback. This is where overbought conditions unwind. * Right now (in resistance zone), take profits on longs and consider short setups if rejection confirms. Aggressive long entry only if $452.34 breaks/holds (early signal) OR a weekly close above $444.99 (confirmation). Early bearish positioning if $TSLA closes below $426.50 – signals potential rotation lower into June. * So, the entire setup comes down to one concept: acceptance vs. rejection at resistance. – Acceptance above ~$445 → trend continuation → momentum higher – Rejection below ~$442 → range/pullback → time correction No guessing tops. No predicting narratives. Just reacting to price behavior at key levels. * Watch the full Trading Plan for May 14, 2026 in this short video🔽

Wicked Stocks

22,667 görüntüleme • 2 ay önce

📺 $TSLA CLOSE BELOW $364.76 TODAY → A SHORT SETUP ACTIVATES Please ❤️like and 🔁share with fellow Tesla traders/investors #Tesla is currently trading inside a wide range between $342.95 (support) and $437.58 (resistance). A confirmed close above $437.58 = strong bullish signal, which opens the path toward the $540s (long-term channel top). It would likely mark a major low already in place for the year. A weekly close below $339.52 (≈1% below support) triggers a 3–5 month sell signal with the downside target of ~$220s ($224.94 area). So, #TSLA is in a range-bound market until proven otherwise — but the breakout (up or down) will be decisive and large. * The key resistance level this week is at $398.25. This level has repeatedly rejected buying pressure. The important filter level is $364.76 (5/8 Fibonacci). Above it → selling pressure is contained, below it → opens downside momentum toward $342.95. $TSLA is currently sitting just above the line that matters most in the short term. * If $TSLA closes today above $377.12 → momentum shift higher, with a likely move to $398.25 within 2–3 days. If #TSLA closes below $364.76 → a short setup activates, with the downside move toward $342.95. We expect a choppy, back-and-forth inside the range. Possible path: bounce → upper $390s, then reject → drift lower again, and then repeat until breakout. * So, $TSLA is neutral to slightly bearish bias below $377.12. Constructive only above $377.12. Look out for $364.7 – danger zone is below it. * Watch the full $TSLA Trading Plan for Apr 27, 2026 in this short video🔽

Wicked Stocks

22,820 görüntüleme • 2 ay önce

📺 $TSLA STILL STRONG BUT EXTENDED – YOU SHOULDN’T BE BUYING HERE Please ❤️like and 🔁share with fellow Tesla traders/investors #Tesla closed strong last week at $428.35. The stock is in a rising channel, with momentum still intact. However, it’s approaching a major resistance zone that could define the next multi-week move. * $442.26 – $444.99 is the critical area, which aligns with the rising channel top and is expected to cap price action through May and possibly June. Base case is #TSLA likely tests this zone this week, then struggles to break higher immediately. Expect then a pullback toward $418 (short-term) and $387.07 (key support), with the potential deeper move toward $347.63 (major support / Q3 bottom zone). * If $TSLA closes this week above $444.99, that’s a confirmed breakout that triggers a momentum “pull-away” move. Upside targets: – $498.83 (December high retest) → within 3–8 weeks – $541.30 → within 2–5 months Note: this only happens on confirmed strength, not intraday spikes. If $TSLA fails at $442–445, expect rotation lower. If it closes the week below $415.83, it will signal a short-term top and open the door to $387.07 (primary target) and potential acceleration lower. * So, what NOT to do: – Don’t chase in the low $440 s – that’s resistance, not opportunity. What to do instead: – Short-term traders may sell / short into $442–445 resistance. Target is $418 (quick trade) and $387 (swing trade). Alternative short trigger: breakdown below $415.83 → short continuation. – Long strategy: stay long above $418, buy dips at $387 (high-probability level) and possibly $347 (if deeper correction). – Breakout buyers: only get aggressive if confirmed close above $444.99. * So, $TSLA is still strong but extended. $442–445 is the decision zone: – Rejection → pullback and range – Breakout → fast move toward $500+ The smart play here isn’t chasing strength — it’s trading the levels and letting the market confirm direction. * Watch the full Trading Plan for May 11, 2026 in this short video🔽

Wicked Stocks

29,516 görüntüleme • 2 ay önce

📺 $TSLA MAY HAVE BOTTOMED… WHAT'S NEXT? Please ❤️like and 🔁share with fellow Tesla traders/investors #Tesla nearly hit the key downside target of $335.93 (actual low was $337.24, within ~1%) on Tuesday. It marked the completion of a multi-week sell cycle from the breakdown below $430.56. The downside move has likely done its job. Now what? * $335.93 is a major long-term support level based on a 6+ month channel structure. If price holds above ~1% of this level, it shifts from bearish continuation to a potential accumulation/reversal zone. This is where swing traders start buying and longer-term players build positions. * $347.53 is the key short-term pivot. If #TSLA opens/holds above this, it signals immediate strength. $356.54 is a major resistance level (50% retracement level). Likely to cap near-term highs initially. So, we expect the first push to test $356, then a possible pullback back to mid-$330s. * However, if momentum holds, we expect the $390.12 – $393.06 zone (3/8 Fibonacci level, channel resistance). Important: this zone can reject the price initially and could lead to range-bound action between $330s and $390s. So, $TSLA may form a wedge/consolidation and trade sideways while “deciding direction.” But we lean bullish if the price holds above $335. If #TSLA breaks and closes above $356.54, then $390s likely within 1–2 weeks. Eventually, we expect a move toward the $430s, even the low $500s, longer term. This isn’t just a bounce — it could be the start of a larger rotation higher. * So, $TSLA likely completed its downside cycle near $335. That level is major structural support, not just a bounce point. Short-term, expect push → resistance → possible pullback. Medium-term: range + consolidation. We expect a gradual move toward $390, then potentially much higher. * If you enjoyed this update, please ❤️like and 🔁retweet Watch the full $TSLA Trading Plan for Apr 8, 2026 in this short video🔽

Wicked Stocks

19,488 görüntüleme • 3 ay önce

📺 $TSLA HIT THE TARGET — TIME TO TAKE PROFITS? Please ❤️like and 🔁share with fellow Tesla traders/investors #Tesla closed Monday at $445.00, already reaching and slightly exceeding the key upside target of $442.26, which we had been anticipating for several weeks after bouncing from $347.63 long-term support. Price is now sitting right at a critical resistance zone: $442.26 → prior target, $444.99 → 5-week rising channel top. So, the key question now – is $TSLA just stretching into resistance (likely a pause/pullback)? Or has it broken through resistance (start of a new leg higher)? We are leaning toward “stretching” for now, not a confirmed breakout yet. For a true continuation higher, price behavior matters. We need a close above $444.99 (ideally two consecutive closes above this level). If this happens, the momentum “pull-away” effect kicks in, and short-term upside targets become: – $453.29 → next resistance (descending channel top) – $474.07 → major target (Nov high zone) If strength builds, $474.07 reachable mid this week (Wed–Thu). If #TSLA closes this week above $444.99, $498.83 (Dec high) is likely within 3–5 weeks, and $541.33 is possible within 2–3 months. This becomes a strong trend-continuation phase. * Today, if $TSLA opens above $444.99 → a quick move to $453.29 is possible. If it breaks above $453.29 → $474.07 becomes reachable even intraday. * Warning signals: – Failure to hold above $444.99 – Close back below $442.26 Stronger downside trigger: – Close below $415.83 → signals trend breakdown $387.07 becomes the downside target. This would shift the structure from trend continuation to a corrective pullback. * So, if already long, stay long, but watch key levels closely. If unsure, wait for a confirmation (close above $444.99). If you are not in yet, your entry becomes more attractive after a confirmed breakout, targeting the $500–$540 range. * So, $TSLA has completed its initial upside move and is now at a critical resistance zone. The market is deciding between: – Pause/consolidation (most likely near-term) – Aggressive breakout into a new bullish phase (if resistance breaks) Everything hinges on how the price behaves around $444.99 this week. * Watch the full Trading Plan for May 12, 2026 in this short video🔽

Wicked Stocks

20,630 görüntüleme • 2 ay önce