Загрузка видео...
Не удалось загрузить видео
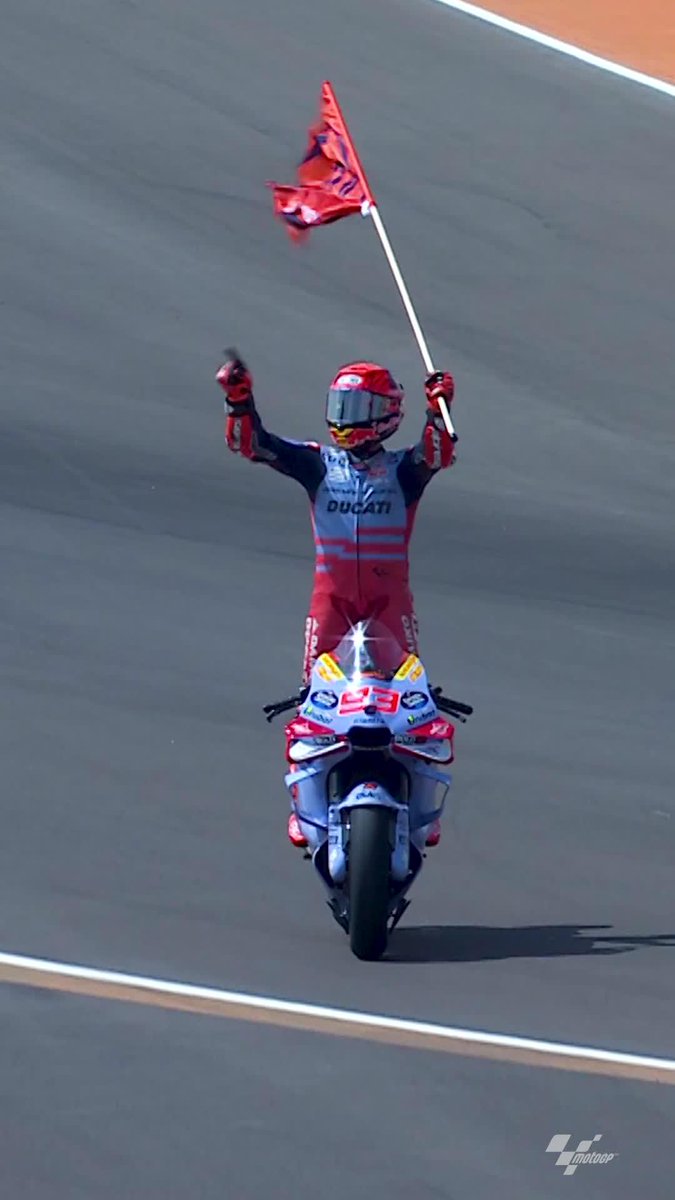
It's been a bumpy road back to winning ways, but the ALONSHOW did it! 💫 Here's a look back on his journey so far 🔙 #AragonGP 🏁

51,037 просмотров • 23 дней назад •via X (Twitter)
Комментарии: 2

Hey Super, build an interactive circuit telemetry and race-line explainer celebrating David Alonso's ('The ALONSHOW') victory at the MotorLand Aragón Grand Prix (#AragonGP). In the first viewport, present an interactive vector circuit schematic of MotorLand Aragón (5.077 km, 17 turns) rendered via SVG/Canvas with an active lap cursor that visitors can scrub along the racing line, immediately updating synchronized telemetry readouts: instantaneous velocity (km/h), bike lean angle (reaching up to 64° through the T8-T9 reverse corkscrew), throttle opening percentage, and brake pressure (bar) alongside turn name, gear indicator, and sector splits (S1 through S4). Below the circuit visualizer, provide a multi-channel telemetry trace viewer (speed, lean, throttle, brake) plotted along the 5,077-meter lap profile. Allow visitors to switch between driving modes—including Alonso's Winning Aragon Lap, Wet-Track Defensive Line, and Sector 3/4 Slipstream Assault—or click individual corners (such as T1 Left Hairpin, T8-T9 Reverse Corkscrew, or the 968-meter back straight leading to T16-T17) to jump straight to critical overtaking apices. Pair the telemetry engine with an interactive 'Bumpy Road Back' milestone visualizer documenting Alonso's resilience, crash recoveries, tactical race craft, and triumph at Aragón. Ensure visitors can toggle metric overlays, compare sector deltas, and export a race telemetry report as structured JSON or print-ready summary. Include persistent local state for favorite sector marks and responsive layouts for mobile and desktop screens.

Good to see Alonso back to wining way's