Загрузка видео...
Не удалось загрузить видео
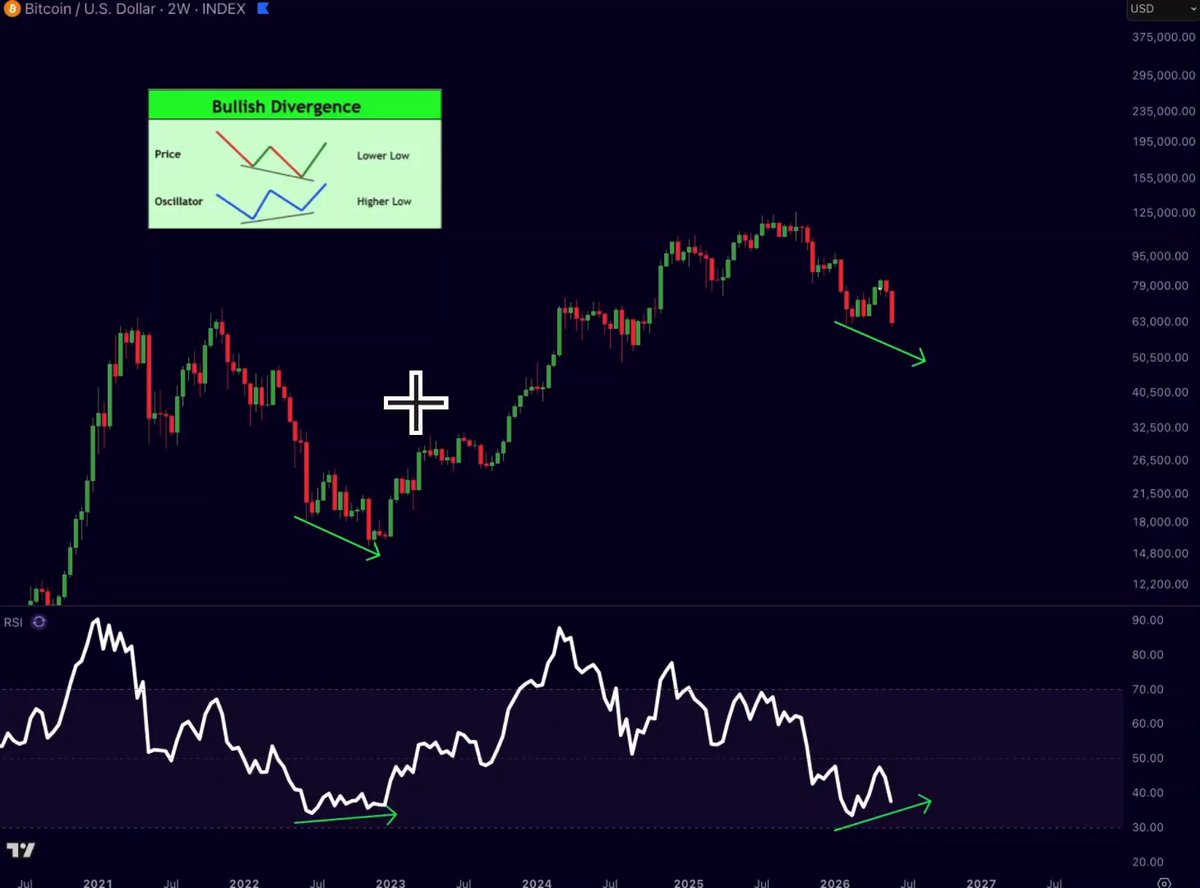
Same Bitcoin bottom signal. Two cycles. 2022: 3 lower lows. 3 higher RSI lows. +700% rally. 2026: 3 lower lows. 3 higher RSI lows .... rally ? The structure that called the 2022 bottom is printing again. Short-term: more pain possible. Long-term: the bottom signal is forming.

35,928 просмотров • 3 месяцев назад •via X (Twitter)
Комментарии: 20

interesting

RSI divergence printing again while everyone's screaming about more downside sounds familiar from 2022 and we all know how that ended

Everyone is focused on the short-term pain, while the bigger picture may be quietly setting up for the next move higher

Bunu izliyorum, önemli seviye.

2022: 3 lows + RSI divergence = bottom 2026: same exact structure repeating Market loves to rhyme Chart shows bullish RSI while price makes new lows If history repeats rally loading

Pattern looks clean, but price tells the tale.

Yes. I believe the weekly RSI divergence would be a good sign.

institutional dynamics changing

I’m expecting an October bottom…

promising signals 🔍

Gold ,Bitcoin important news Must watch this

at some point the market stops being complicated and just rewards the patterns that actually make sense this one checks every box

However, in the long run, this is the golden window for accumulating positions. Keep buying and hold patiently, I believe that when the bull market arrives, $120000 will be just the beginning

Interesting pattern for sure, but I’d want to see a few more confirmations before getting too excited, mate

Interesting pattern to watch

@MerlijnTrader Appreciate the timely coverage and clear reporting. 👏

interesting chart. the bids upstream are looking a little thin though. we'll see if price remembers that.

it's tempting to see history repeat, but the specific percentage rally is never a certainty from rsi divergence alone. market structure shifts.

Nice chart, the RSI strength stands out

Spot on analysis! BTC weekly chart showing the same 3 lower lows + higher RSI lows structure as the 2022 bottom. That signal preceded a +700%+ rally from ~$15.6k lows to the $126k ATH. Now at ~$63.5k after a 50% correction - short-term dips possible but the long-term setup looks constructive. Sources: - Current price & ATH: - 2022 low & history: - RSI comparison to 2022: