Video wird geladen...

Video konnte nicht geladen werden

Zur Startseite

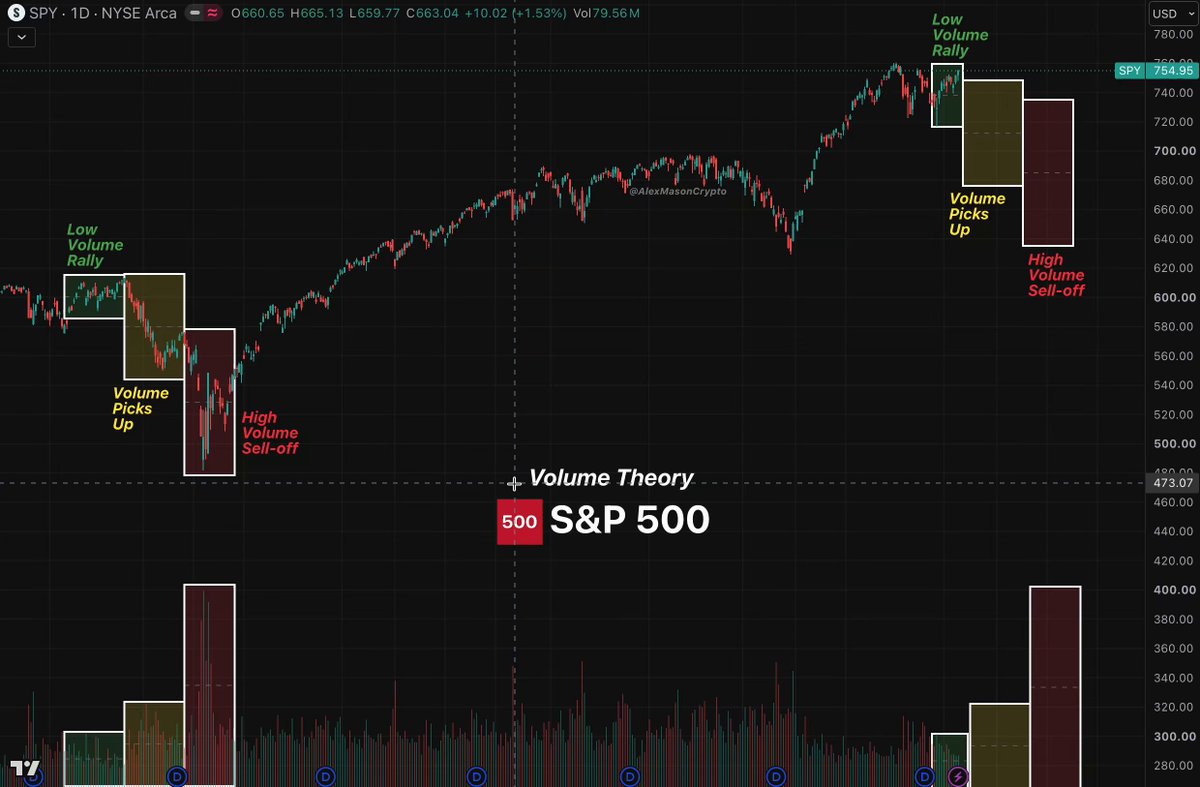
STANDARD DEVIATION Secret REVEALED, FOR FREE!!! I didn’t know how to use Standard Deviation for 29 years until I watched this ICT video The market makers are shaking right now Credits: Michael J Huddleston February 10, 2023 Price Action, $ES, E-Mini S&P 500 Futures

16,265 Aufrufe • vor 2 Monaten •via X (Twitter)

0 Kommentare

Keine Kommentare verfügbar

Kommentare vom Original-Post werden hier angezeigt

Ähnliche Videos

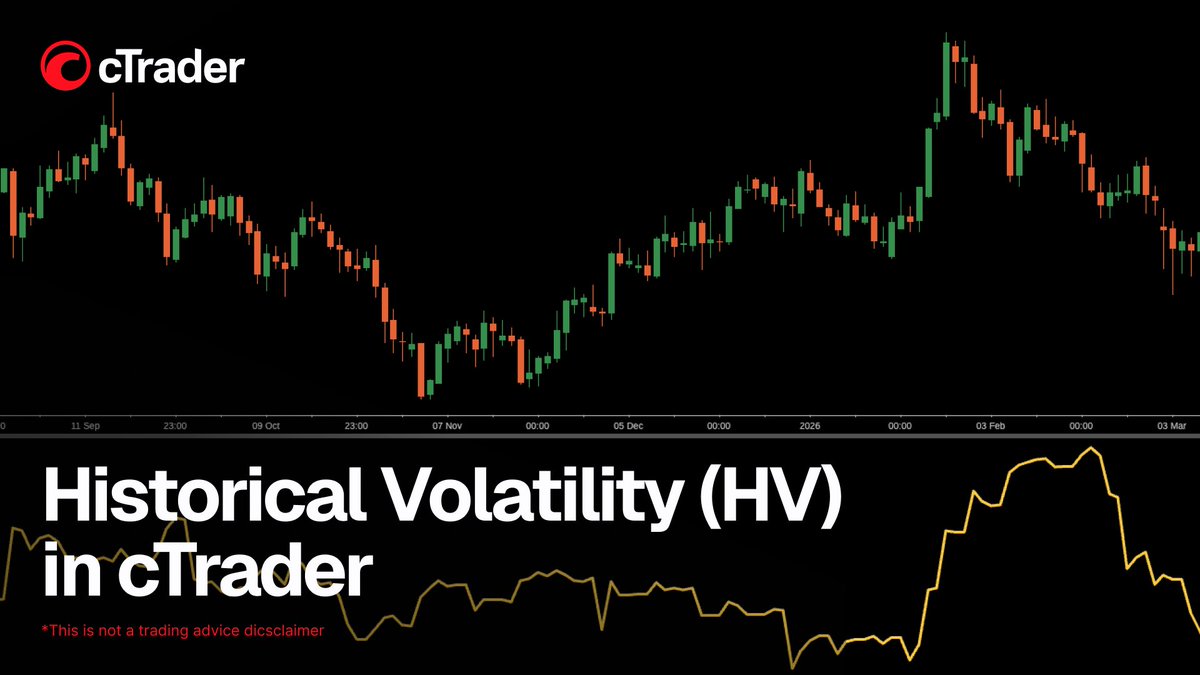
🎥 Historical Volatility (HV) in cTrader - how it works and how to use it In this video, we explore Historical Volatility (HV) in cTrader - an indicator that measures past price fluctuations over a specific period, helping traders understand market variability and risk. You’ll learn where to find the Historical Volatility indicator in cTrader, how it is calculated using logarithmic price returns, standard deviation and annualisation, and how to customise settings such as standard deviation and bar history. We also look at how traders use HV to: • Identify rising volatility and expanding market swings • Recognise falling volatility and quieter market conditions • Confirm breakout conditions and trend continuation • Adjust protection and stop-loss placement based on market volatility • Combine HV with indicators such as ADX or moving averages • Use HV in cBots 📍 Timecodes 00:09 – Introduction: what is Historical Volatility (HV) 01:14 – Where to find Historical Volatility and how to customise its settings 01:34 – How Historical Volatility helps identify changing market conditions 02:29 – Using HV to confirm breakouts and trend continuation 03:39 – Using volatility to adjust protection and stop-loss placement 05:08 – Combining HV with other indicators and using it in cBots - Learn more about the Historical Volatility - - Join Discord - Don’t forget to like and share your thoughts in the comments! _____________________________________ 👉 Start Trading with cTrader - 👈

cTrader

11,530 Aufrufe • vor 5 Monaten

$10,000 invested with Jim Cramer in 2001 turned into $28,997 by 2020. The same $10,000 in a free S&P 500 index fund? $44,957. Jim Cramer's CNBC Investing Club is TRASH... But they're still gassing him up. Wharton School researchers tracked Cramer's Action Alerts PLUS portfolio for over 17 years. The verdict: 3.38% annualized returns versus the S&P 500's 5.59%. More volatility. Lower returns. A Sharpe ratio of 0.11 versus the index's 0.24. You were taking on MORE risk for LESS reward. But it gets even worse. From inception through June 2023, cumulative total return: 230%. The S&P 500 with dividends reinvested: 453%. From 2016 to 2022, Action Alerts outperformed the market exactly ONCE. And you were paying $399 a year for the "privilege". Here's what really bothers me: CNBC sells this product to retail investors who trust the brand. Regular people. People without decades of experience to know better. They watch the flashing lights, the sound effects, the screaming - and assume there's actual substance behind this. There isn't. After adjusting for market risk, Cramer's excess return was "essentially zero." Not alpha. Noise. And SVB? First Republic? February 2023: Cramer told viewers to BUY Silicon Valley Bank. One month later it collapsed. He called First Republic "a very good bank." It failed two months after that. Catastrophic calls on systemically important institutions. Delivered to retail investors with total confidence. I've spent 45 years in this business. I worked for Peter Lynch. I know what genuine investment analysis looks like. What CNBC sells is infotainment dressed as financial advice. The index fund is free. It outperforms. Remember that the next time someone tries to sell you a $399 subscription to underperform the market. Say NO to Cramer and CNBC.

George Noble

50,661 Aufrufe • vor 6 Monaten