正在加载视频...

视频加载失败

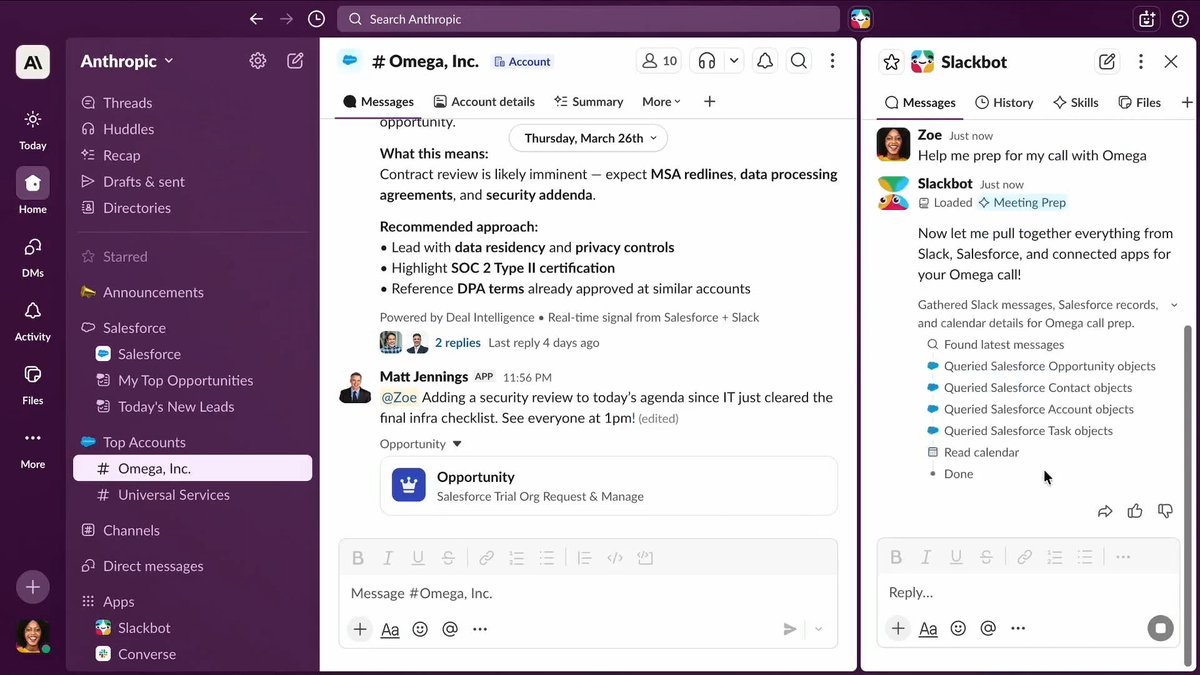
Stop wasting 30 minutes every morning checking dashboards like it's 2015. This workflow pulls your CRM data and drops a mini-dashboard in Slack automatically. Your leads, calls, and revenue served fresh daily. Follow + comment "DASH" + follow and I'll DM the automation.

28,791 次观看 • 1 年前 •via X (Twitter)

10 条评论

Tom 的头像
Tom1 年前

If you want 2-3 minute insights weekly on using AI to get more clients, make more money, and eliminate manual lead chasing forever Join my AI Client Machine newsletter here:

Hassan Jamal 的头像
Hassan Jamal1 年前

DASH

Dan 的头像
Dan1 年前

DASH

TMB 🇧🇷 的头像
TMB 🇧🇷1 年前

DASH

catou 的头像
catou1 年前

DASH

K 的头像
K1 年前

DASH

realnigger 的头像
realnigger1 年前

DASH

Mikey P💭 的头像
Mikey P💭1 年前

DASH

Arnoldo Garza 的头像
Arnoldo Garza1 年前

DASH

Pratyush Singh 的头像
Pratyush Singh1 年前

DASJ

相关视频

I built this CEO dashboard for my client. And it changed how they run their entire business. 1/ Before this dashboard, they were making decisions in the dark. Revenue, profit, and marketing spend scattered across spreadsheets and platforms. - No single source of truth. - No real-time profit and loss visibility. - No way to see which channels were actually driving growth. 2/ Here’s what this dashboard delivers: Executive Overview: → $102K total revenue tracked live → $79.8K gross profit and 78% gross margin calculated automatically → 15% contribution margin, updated in real time → $5,880 revenue this week, always visible Profit & Loss Clarity: → Visual breakdown of revenue, COGS, transaction costs, and marketing spend → Instantly see contribution margin and where profit is made (or lost) Revenue & COGS by Type: → Instantly compare new vs. returning revenue and costs → Know exactly what’s driving growth and what’s eating margin Marketing Spend by Channel: → Compare Meta vs. Google spend → See which channel is delivering the best ROI Revenue vs. Marketing Spend Trends: → Visualize how every marketing dollar translates to revenue over time Conversion & Order Insights: → Track sessions, orders, conversion rates, AOV, MER, CPA, and more live Dark mode or light mode? → This dashboard looks stunning with these two options. No more squinting at numbers. Details are always crystal clear. 3/ The transformation was instant: Before: → Hours spent pulling numbers from different platforms → Guessing at profit and loss → No clarity on which channel was working After: → 10 minutes daily reviewing live insights → Real-time, data-driven decisions → Confident budget allocation and growth planning 4/ The business impact: → Faster decisions → Smarter optimizations → A client who finally feels in control of their numbers This isn’t just a dashboard. This is executive intelligence. Every metric tells a story. Every trend reveals an opportunity. Every insight drives profit. Want a dashboard that makes your business look (and run) like a million bucks? I build custom dashboards & AI automation systems that give you real-time clarity and control. - Real-time data - Predictive insights - Automated reporting - Intelligent alerts Ready to stop guessing? Like + Comment "CEO DASHBOARD" and I’ll DM you a free resource to help you track the top 5 metrics every CEO should monitor.

Lian Lim | Dashboard & AI Automation Expert

115,614 次观看 • 9 个月前