Loading video...

Video Failed to Load

Go Home

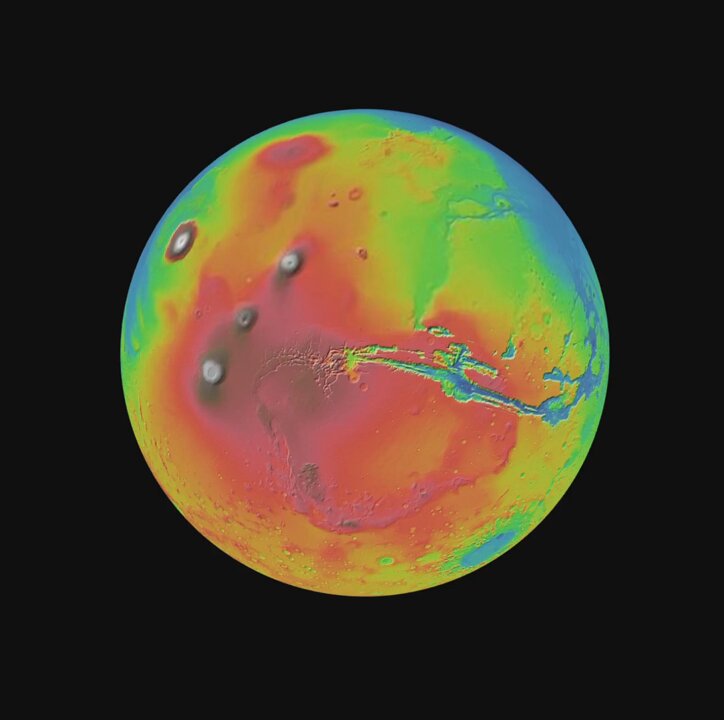
The "3d-tiles" renderer is slowly becoming "any tiled data" renderer - newly added support for WMTS tiled images brings a whole new world of mapping data to #threejs. Including the massive catalogue of data from NASA GIBS! Demo below 👇 #webgl #gis #3dtiles #nasajpl #nasa

15,011 views • 11 months ago •via X (Twitter)

0 Comments

No comments available

Comments from the original post will appear here

Related Videos

A new roadmap. A New Era of The Graph 🗺️ The Graph’s new roadmap introduces a bold and transformative vision for the future of The Graph! The new R&D roadmap details an expansion of The Graph’s ability to serve web3’s growing demands for data access, while better serving builders and protocol contributors, and improving the overall simplicity and efficiency of the network. After three years of serving builders, The Graph Network is mature, reliable, and performant. The Graph ecosystem has followed through on its commitment to democratize access to blockchain data while also establishing subgraphs as a web3 standard. But The Graph’s innovation journey doesn’t end there. The New Era of The Graph is organized into five core objectives: 1️⃣ World of Data Services: Expanding to provide new data services beyond subgraphs to deliver a rich market of data on the network, serving novel use cases for data scientists and more. This will include more data sources, new query languages, and support for LLMs. 2️⃣ Developer Empowerment: Supporting developers through enhanced DevEx and tooling by introducing streamlined billing, clear pricing models, a new free query plan, and reduced gas fees. A more SaaS-like experience for devs, without compromising on decentralization! 3️⃣ Protocol Evolution & Resiliency: Delivering improvements resulting in a more resilient, flexible, and simple protocol, including updates to delegation. 4️⃣ Optimized Indexer Performance: Boosting network performance with improved Indexer tooling and operational capabilities to deliver increased scalability, reduce costs, and enhanced network reliability. 5️⃣ Interconnected Graph of Data: Creating tools for composable data and a global, organized knowledge graph – interlinking open data and making it easier to build upon. The new roadmap sets in motion an exciting evolution in web3 data infrastructure. In a phased rollout, The Graph will introduce many new features and benefits, including the integration of new data services, new query languages, enhanced developer tooling, improved UX + UI, alongside greater protocol efficiency and resilience. As this new era unfolds, The Graph crystallizes as the connective tissue across the many layers of the web3 stack, evolving into a comprehensive, interwoven graph of data equipped to serve every project dreamt up by web3’s innovators. Read the full announcement linked in the comment below!

The Graph

425,373 views • 2 years ago

GeoLibre v2.4.0 is here! GeoLibre is a free and open-source, lightweight, cloud-native GIS platform for visualizing, exploring, and analyzing geospatial data. It runs everywhere you do, in the web browser, on the desktop, on mobile, and inside Jupyter notebooks, all while keeping your data local and private. This release is about reaching more data and moving through it: new browsers for STAC, NASA Earthdata, and Hugging Face, a flight simulator, a Time Slider that animates tiled data and data cubes, and a live API for pages that embed the map. What's new in v2.4.0 - STAC catalogs browser: discover public catalogs from STAC Index, connect to static catalogs and STAC APIs, search a collection's items, and add any visualizable asset to the map. No more copying COG URLs by hand. - Earthdata GIS browser: search NASA's Earthdata GIS portal and add its imagery, map, and feature services, and its published web maps, as first-class layers. - Hugging Face on the map: search the Hub, walk a dataset repo's folders, and add its vector and raster files. You can create a dataset repo and upload layers to it too. - Flight Simulator: steer a continuous free-flight camera over terrain and 3D layers from the keyboard, instead of declaring a destination and watching a scripted flight. - Time Slider for tiled data and data cubes: bind vector tiles, PMTiles, and MBTiles to the timeline and animate them over their full extent, and let a Zarr store's own time dimension join the shared timeline. - Zarr gets a real Add Data path: open a remote store or a folder on disk, and pick variables and dimensions by their actual coordinate values rather than raw indices. - Live embed API: a versioned postMessage protocol so a host page can load a project, move the camera, highlight features, and open a tool at runtime, with events coming back out. - OGC API - Features: add collections as vector layers from whatever URL you have in hand, whether that is a landing page, /collections, or a full items URL. - H3 everywhere: a new hexagonal grid plugin that renders and inspects H3 cells and exports them as GeoJSON or CSV, plus typing an H3 index into the search box to fly straight to that cell. - Jupyter from outside the app: attach VS Code's Jupyter extension or jupyter console to the desktop app's server and your notebook cells drive the map. Try it out - Launch GeoLibre Web: - GitHub: - Documentation: - Release notes: #GIS #Geospatial #OpenSource #RemoteSensing #DataVisualization #GeoLibre

Qiusheng Wu

13,883 views • 9 days ago