Video yükleniyor...

Video Yüklenemedi

Ana Sayfaya Dön

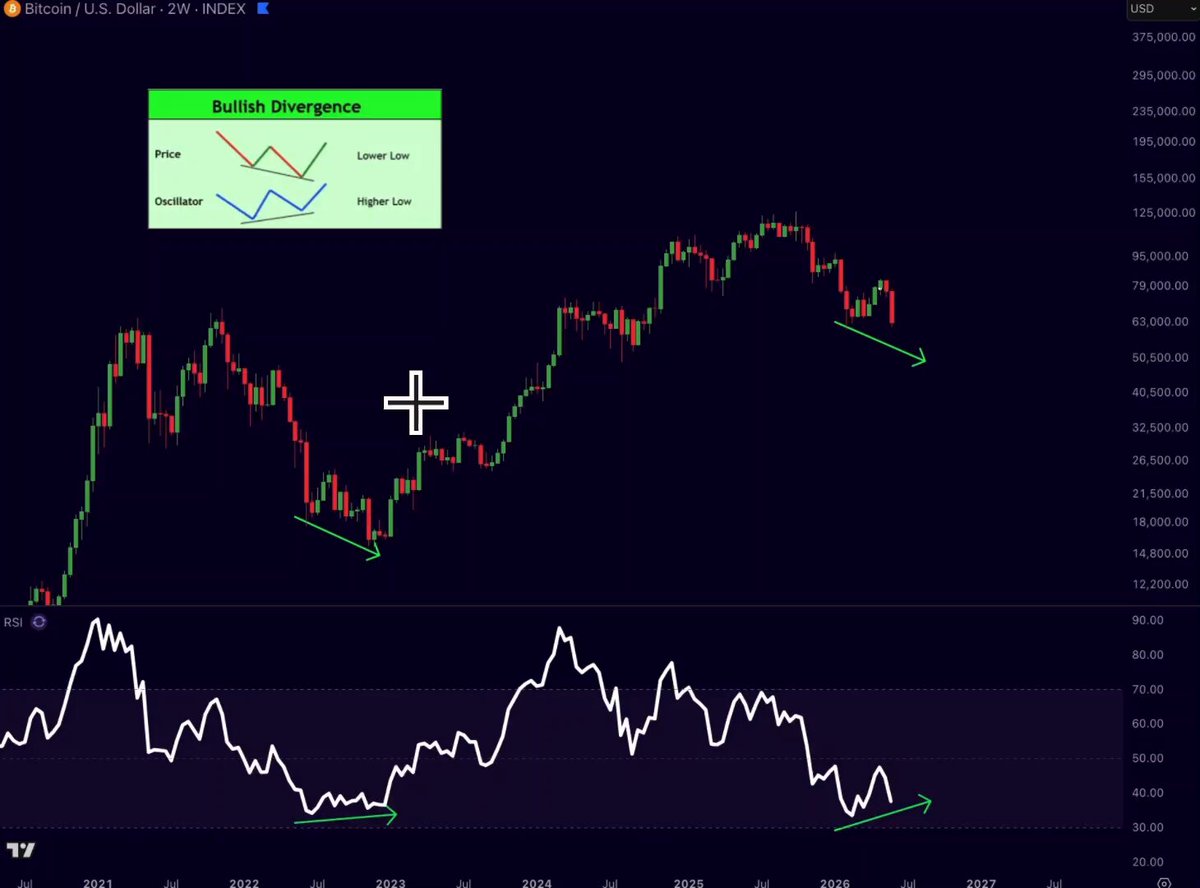
THIS BITCOIN PULLBACK COULD BE YOUR LAST CHANCE BEFORE THE NEXT BIG RALLY. Bitcoin is around $77K, testing the 50-week moving average after rebounding from its base. The comparison with the 2022 bottom is what keeps me bullish, 144 days, three corrections, and bullish RSI divergence. I’m looking to...

16,127 görüntüleme • 2 ay önce •via X (Twitter)

19 Yorum

WallStreetX profil fotoğrafı
WallStreetX2 ay önce

Yeah, the 50-week MA looks like the line in the sand right now—everyone seems to be watching the same level.

DuckDice profil fotoğrafı
DuckDice2 ay önce

77k feels like the calm before the memestorm

Tomáš Janota profil fotoğrafı
Tomáš Janota2 ay önce

50-week test makes sense, clean setup

Merlijn The Trader profil fotoğrafı
Merlijn The Trader2 ay önce

thanks every dip is accumulation time

Syfer profil fotoğrafı
Syfer2 ay önce

77k is a gift not a loss

Merlijn The Trader profil fotoğrafı
Merlijn The Trader2 ay önce

Yessir 🫡

Macro Bombastic profil fotoğrafı
Macro Bombastic2 ay önce

yeah I'm watching that 50 week too, feels like everyone's waiting on the same level

Swallow Academy profil fotoğrafı
Swallow Academy2 ay önce

Tbh, I’d rather accumulate these pullbacks than chase.

Bitcoin Clarity profil fotoğrafı
Bitcoin Clarity2 ay önce

The next couple days will answer alot of questions, can’t wait

Merlijn The Trader profil fotoğrafı
Merlijn The Trader2 ay önce

thats true massive whicks and ppl crying I guess due to over levered trades

Bitcoin Clarity profil fotoğrafı
Bitcoin Clarity2 ay önce

100%, almost impossible to use leverage right now

Cassator Corp. profil fotoğrafı
Cassator Corp.2 ay önce

“last chance” has appeared about 40 times this cycle but reclaiming the 50-week would actually be worth paying attention to

Volf Web3 profil fotoğrafı
Volf Web32 ay önce

Solid analysis. The 2022 parallel RSI divergence is exactly why I’m also accumulating here. 50W MA reclaim game on.

yard profil fotoğrafı
yard2 ay önce

Lets all short eth hahah

Mike profil fotoğrafı
Mike2 ay önce

You bring clarity to trends that are usually difficult to understand. You and @Kendallde_ are setting a new standard.

Anthony Junior profil fotoğrafı
Anthony Junior2 ay önce

The 2022 comparison is interesting, but the 50-week MA reclaim is the real confirmation. Until then, $130K remains a thesis rather than a signal.

Giovanni DAILY profil fotoğrafı
Giovanni DAILY2 ay önce

let's go

Linus Van Pelt profil fotoğrafı
Linus Van Pelt2 ay önce

If the 50W MA flips back into support, $130K would definitely become an exciting target. 🚀

The_Bag_Reaper profil fotoğrafı
The_Bag_Reaper2 ay önce

That all caps start about COULD BE is click bait BS. I don't see a lot of that from you. Guess uncertainty is strong here. LH printed. Next is LL

Benzer Videolar

Let’s briefly look back at what actually happened back then, before the breakout was visible, as in the August thread. In 2023, the final bottom formed 147 to 161 days after the wick outside the blue TEM zone. The 161 days are explained by COVID, the FTX crash, and a two-week delay with a price difference of less than 1%. What matters is the time interval itself. It took 245 days to reach the top. The move from the wick outside the blue TEM zone to the top was +43.5%. From the last low, Bitcoin pumped for three weeks, then moved sideways for three weeks, and after that consolidation gained more than +24% within one week. The impulse ended after exactly three weeks with the first sign of weakness and a pullback of -11%. The highest high formed in week six. After that, price dropped -22%. From the end of the three-week sideways phase to the peak, it took 42 days. In 2026, the final bottom formed 147 days after the wick outside the blue TEM zone. It took 231 days to reach the top, without the two-week delay from back then. The move from the wick outside the blue TEM zone to the top is +45.5%. Here as well, Bitcoin pumped for three weeks from the last low, then moved sideways for three weeks, and after that consolidation gained more than +24% within one week. After exactly three weeks came the first sign of weakness and a pullback of -9%. The highest high formed again in week six and therefore lines up with the current week. From the end of the three-week sideways phase to the peak, it again took 42 days. A final upside impulse is possible and cannot be ruled out. If the structure repeats 1:1, the local top is already in. The key levels are the 50-week EMA/SMA . If Bitcoin finds support there, the path toward $100,000 remains open! If the pattern repeats 1:1, Bitcoin would likely sit around $78–79k next week, then pump into $82/83k. What matters is whether this range holds. The pattern is too precise to dismiss as coincidence. bitcoin:native

XAPA

172,169 görüntüleme • 1 ay önce