Загрузка видео...

Не удалось загрузить видео

На главную

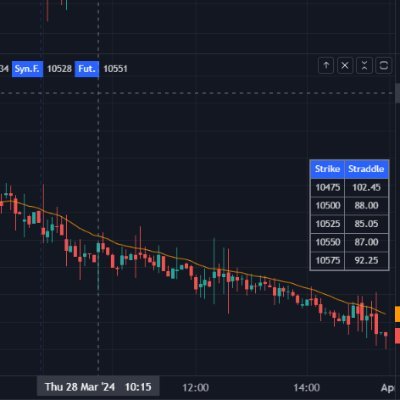
Trading View - Option Chain Experimental Indicator that shows CE/PE Ltp, Volume, Traded Value (Ltp x Volume) for the chart timeframe Once OI data is available on Trading View , OI data will be added as well. Link [ Animation - Traded Value per min.
46,583 просмотров • 2 лет назад •via X (Twitter)

Комментарии: 11

Фото профиля Keshav Arora
Keshav Arora2 лет назад

Ek hi Dil hai Kitni baar jeetoge sir 🙏

Фото профиля blackswan
blackswan2 лет назад

Oh wow this looks cool 👌

Фото профиля Aniket jain
Aniket jain2 лет назад

What are benefit of it 🤔

Фото профиля AKM
AKM2 лет назад

Great work 👍

Фото профиля TradingAlgo
TradingAlgo2 лет назад

This looks 🔥

Фото профиля Arghya Ray
Arghya Ray2 лет назад

Excellent

Фото профиля Mr. आत्मनिर्भर बेरोजगार
Mr. आत्मनिर्भर बेरोजगार2 лет назад

Very nice

Фото профиля Aman Jain🫰🏻
Aman Jain🫰🏻2 лет назад

Kya baate hai Sir. Ek number

Фото профиля Shivam Pardeshi
Shivam Pardeshi2 лет назад

Damn 🙌🏻

Фото профиля Rajesh.D
Rajesh.D2 лет назад

It's only for bank nifty??

Фото профиля I Luv Markets
I Luv Markets2 лет назад

Go to Inputs and adjust the Ref Strike and Expiry Date

Похожие видео

Why did Ian Whiffin agree to give expert testimony on Jen McCabe’s cellphone extraction, when the state refused to let him look at or even give him the full, original extraction OR its verification hash? A thread🧵 Full cellphone extractions, sometimes called forensic images, generate what’s called a “hash value”, which serves as a unique digital fingerprint necessary for ensuring the integrity of data. Any discrepancy between the hash values indicates tampering with or corruption of evidence, alerting forensic examiners to potential issues with the evidence. Hash verification is a fundamental principle and a rather ubiquitous practice in the world of digital forensics, where data validation and verification are key. It is the gold standard across the industry, and has also become so in the courtroom, whereby admissibility of digital evidence is determined by its relevance, authenticity and reliability. In court, the hash value can be used to demonstrate that the evidence has not been altered since its collection, and is a universal way for experts to authenticate and validate the reliability of data for the trial Court. But, an extraction that’s missing a hash value altogether is a huge red flag. 🚩 Who removed the hash value? And why? It’s necessary to the chain of custody, and as Gaurino and Tully would be well aware, it’s also an element of the data that an expert would require in order to verify and validate it. There’s no “good” reason for why someone would remove a hash value, and the extraction can’t be characterized as a forensic image as its origin is unknown. This was a deliberate step taken to hide something, which one could argue shows consciousness of guilt. If the data are true and accurate, why would you bring their integrity into question by removing the hash? However, if the data were altered or tampered with, and let’s say, hypothetically speaking, you wanted a digital forensic expert to provide testimony supportive of your “Google search” theory. . . In that hypothetical, you’d have to remove the hash value. Otherwise, the expert would immediately detect that the data were altered, as they would not be able to verify the hash against the original. #KarenReadTrial #JusticeForJohnOKeefe #FreeKarenRead #CantonCoverup #PoliceCorruption #KarenRead #Cellebrite #DFIR

Olivia

270,376 просмотров • 1 год назад

CSS in 2024 🤯 You can create a range slider with updating value tooltip and color changing track without using any JavaScript 🤯 ::-webkit-slider-thumb{ view-timeline: --thumb inline; } Scroll animation on the slider thumb that animates a number between the "min" and "max" of the range 😅 @​property --value { syntax: ' '; } @​keyframes sync { to { --value: 100; }} Tie that up to the contain animation-range ⚡️ .control { animation: sync both linear reverse; animation-timeline: --thumb; animation-range: contain; } Hoist the view timeline so the tooltip can use the value too! :root { timeline-scope: --thumb; } Then use it in the counter which goes in the tooltip 😇 .tooltip { counter-reset: val var(--value); } .tooltip::after { content: counter(val); } Then the accent color is based on the value too 🎨 [type=range] { accent-color: hsl(var(--value) 90% 65%); } The magic from the quoted post is using anchor positioning on the range thumb to position that tooltip 👏 Never thought of that when working on the spec for this API. This API lets you tether elements to other elements. Using the pseudo is a clever move! ::-webkit-slider-thumb { anchor-name: --thumb; } .tooltip { position: absolute; anchor-default: --thumb; left: anchor(50%); bottom: calc(anchor(top) + 25%); } The last piece is the little bounce transition... OK. I used a line or two of JavaScript for that 🙏😬 const updateDelta = ({ movementX }) => { document​.documentElement​.style.setProperty('--delta-x', movementX) } document.body.addEventListener('pointermove', updateDelta) But only so you can pass the movement delta to CSS and then reset the position with linear() to get that bouncy transition 😎 .hint { rotate: calc(clamp(-60, var(--delta-x) * -1, 60) * 1deg); transition: rotate 1s linear( 0, 0.2178 2.1%, 1.1144 8.49%, ... ); } Should probably do a video on this one. Lots of little tricks to break down with it for sure! 💯 As always, any questions, let me know! Also, this one only works in Chrome Canary with the Experimental Web Platform Features flag enabled ✅ This one almost feels like rocket science ha 🚀 CodePen.IO link below! 👇

jhey ʕ•ᴥ•ʔ

251,867 просмотров • 2 лет назад

MIT defines an algorithm in one sentence that changes how you think about trading "a computational procedure that takes an input and produces an output through a well-defined sequence of steps" that's it. not AI. not machine learning. not a black box a set of rules that takes data in and spits a decision out every quant strategy ever built is just an algorithm Citadel's execution system that routes 40% of US equity volume is an algorithm Renaissance's Medallion Fund running millions of trades per year is an algorithm Jane Street's market making engine processing $26 trillion annually is an algorithm input: market data rules: mathematical conditions output: trade or no trade the difference between a quant desk and a retail trader is not the data it's that one side wrote down their rules precisely enough for a machine to execute them retail says "if RSI is low and the chart looks good, i'll probably buy" a quant desk says "if RSI 1.5, buy 0.3% of NAV" same logic. one is a feeling. the other is an algorithm the feeling can't be tested, can't be repeated, can't be measured the algorithm can be backtested across 10,000 trades and you know exactly when it works and when it doesn't > this lecture: MIT, free, 70 seconds > algorithmic trading volume: 60-75% of all US equity trades > Jane Street, Citadel, Two Sigma: every trade is algorithmically executed > tools to build your own: Python, free data, a laptop you don't need a faster computer or better data you need to write your strategy down precisely enough that a machine could run it without you that's the whole leap. from intuition to algorithm full breakdown in the video below

delost

23,905 просмотров • 1 месяц назад