正在加载视频...
视频加载失败
Voronoi diagram (black points) computed by projecting vertically lower envelope of n 3D graphs of functions {(x,y_i(x))} with y_i(x)=D(x_i,x) (pink). When distance D(x,x')=‖x-x'‖^2, graphs of y_i are paraboloids and Voronoi cell borders are linear
32,230 次观看 • 4 天前 •via X (Twitter)
0 条评论
暂无评论
原始帖子的评论将显示在这里


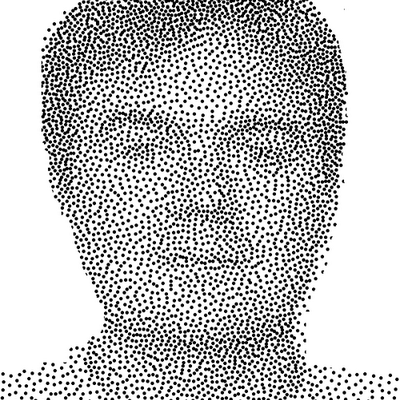
![Let X = exp(A²/2) and Y=exp(B²/2) where A,B are joint normal with mean 0, variance 1, and correlation ρ (between 0 and 1). Then, E[X|Y] = Y/ρ > Y E[Y|X] = X/ρ > X So X is greater than Y 'on average', and Y is greater than X on average. Here's a proof of that](https://image.24vids.com/tw-1969679527325438382/amplify_video_thumb/1969678666427723776/img/FKRxZ9x0Fr9RclVV.jpg)


![a=(x,y,d=2*cos(mag(k=x/8-25,e=y/8-25)/3-t))=>[x+d*k,y+d*e] s=3,t=0,draw=$=>{t||createCanvas(w=400,w);background(6).stroke(255,196).randomSeed(0);for(t+=.02,y=100;y<300;y+=s)for(x=100;x<300;x+=s)line(...shuffle([a(x,y),a(x,y+s),a(x+s,y)]).flat())} //#つぶやきProcessing](https://image.24vids.com/tw-1834565466515185862/ext_tw_video_thumb/1834565286550437888/pu/img/ur8bKR-_v_u2Lx57.jpg)
![t=0,d=5e-4,draw=_=>{t++||createCanvas(w=400,w);background(9).stroke(w,96);for(x=y=z=9,i=3e4;i--;point((q=x*(e=sin(t*PI/20-x*x/99+i%9)+1)+89)*cos(k=z/59-e/29+t*PI/480+i%9*8)+200,200-(q+60*cos(k/2))*sin(k)))[x,y,z]=[x+9*(y-x)*d,y+(x*(28-z)-y)*d,z+(x*y-z-z)*d]}//#つぶやきProcessing](https://image.24vids.com/tw-2053149494439800895/amplify_video_thumb/2053149279209041920/img/F2efugYGtiONxT8N.jpg)

![a=(x,y,d=-exp(-mag(k=w*noise(t)-x,e=w*noise(t,9)-y)/(1+45*noise(x/30,y/30))+.5))=>[x+k*d,y+e*d] s=3,t=0,draw=$=>{t||createCanvas(w=400,w);noFill(t+=.02);background(248);for(y=100;y<300;y+=s)for(x=100;x<300;x+=s)triangle(...[a(x,y),a(x,y+s),a(x+s,y)].flat())} //#つぶやきProcessing](https://image.24vids.com/tw-1830678717410259141/ext_tw_video_thumb/1830677968206901248/pu/img/vaTJfrr4WULeAmut.jpg)
![a=(x,y,d=-exp(-mag(k=w*noise(t)-x,e=w*noise(t,9)-y)/(40+145*noise(x/50,y/50))))=>[x+k*d,y+e*d] s=4,t=0,draw=$=>{t||createCanvas(w=400,w);noFill(t+=.02);background(248);for(y=0;y<w;y+=s)for(x=0;x<w;x+=s)triangle(...[a(x,y),a(x,y+s),a(x+s,y)].flat())} //#つぶやきProcessing](https://image.24vids.com/tw-1830677030259839352/ext_tw_video_thumb/1830676536556707840/pu/img/Iyi8vemHITQyDrZv.jpg)

![a=(x,y,d=5*cos(o=mag(k=x/8-25,e=y/8-25)/3))=>[(q=x/2+k/atan(9*cos(e))*sin(d*4-t))*sin(c=d/3-t/8)+200,(y/3+d+q)/2*cos(c)+200] t=0,draw=$=>{t||createCanvas(w=400,w);background(6,19);for(t+=PI/60,y=99;++y<300;)for(x=99;++x<300;stroke(x,y,y+x,36))point(...a(x,y))} #つぶやきProcessing](https://image.24vids.com/tw-1845176835468034120/ext_tw_video_thumb/1845176700369608704/pu/img/vsonijSthcv6bSbd.jpg)
