
Aaron Dishner
@MooninPapa • 18,144 subscribers
Teaching. Trading. TBO. Crypto courses at The Better Traders & Mastering Assets. Official links below👇
Videos

BTC has now wicked above the same resistance three times in five days, and that keeps weakening the level. I still think the most likely short-term move is a push toward the CME gap at $81,145, but I do not like the risk to reward for longs up here. If my bigger bearish thesis is right, this rally is setting up a much better short later, not a chase long now. That bigger picture still matters more to me. April has already done the heavy lifting, while the historical setup for May and June still points to deeper downside and much bigger volatility. If that pattern keeps tracking, BTC could still be setting up for a much harder drop over the next two months. ETH still looks weaker than BTC, BTC dominance keeps pressing higher, and TOTALES is holding up better than the smaller alt indexes. But TOTALE50 and TOTALE100 are both flashing more bearish reversal pressure underneath, so I still think altcoins are vulnerable even if some charts are bouncing for now. In TradFi, DXY and USDJPY both still look capable of pushing higher, ES finally cooled off after a strong streak, the VIX is trying to turn, and the Nikkei still looks strong but not invincible. On the watchlist, I am paying closest attention to XMR, XLM, CHZ, STRK, H, HYPE, TAO, XRP, RENDER, and SOL.
Aaron Dishner69,521 görüntüleme • 1 ay önce

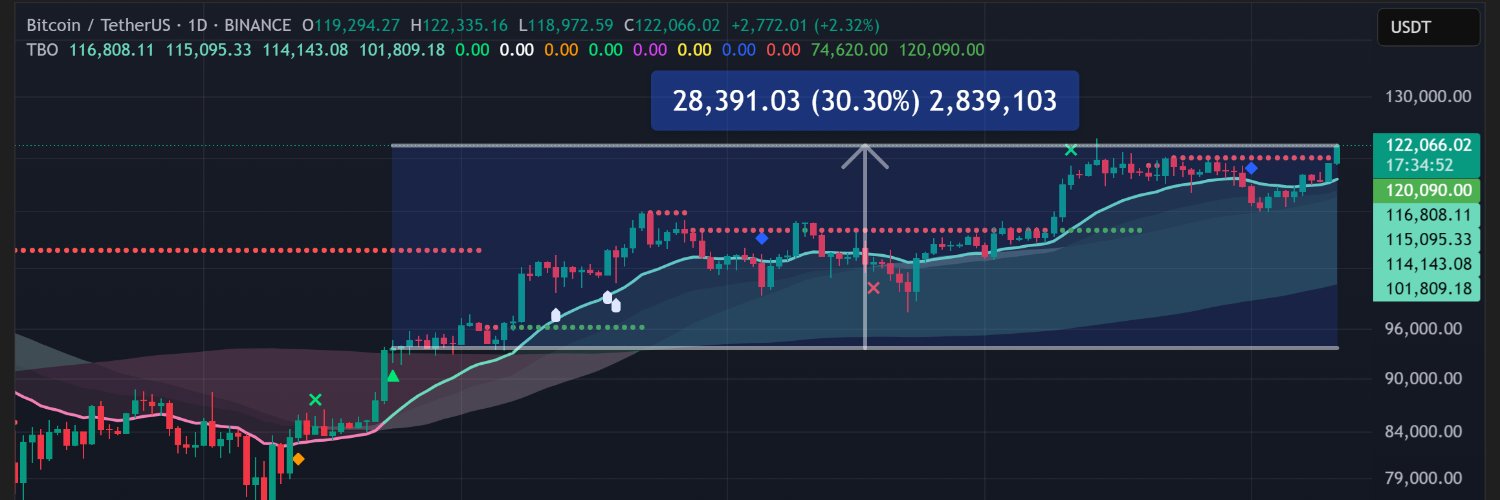
Bitcoin just hit a new all-time high at $125k- but if you haven't noticed, ALTs aren't pumping big time. Why is that? Simple: Bitcoin Dominance is increasing (just as expected). But when BTC.D peaks at about 61%, I expect it to fall and give way to the next ALT rally. LOTS of coins to watch, so pay attention 👇
Aaron Dishner110,371 görüntüleme • 8 ay önce

BTC had a great push up above $114k yesterday, only to lose it all on more tariff and China news. BUT! The good news is that BTC's upper wick has "paved the way" for the price to revisit yesterday's highs today! I still expect BTC to make its way up to $130k by the end of this month. Combined stablecoin dominance pushed higher yesterday on the pullback, but it also printed a second TBO Close Long on the 4h time frame- just like it did preceding every other pullback (which led to a rally for BTC and ALTs!). Gold had a HUGE drop of -5% yesterday- the biggest since 2020. But is Gold's sell-off going to fuel BTC's pump? I don't think so, but you'll have to watch to know why. LOTS of ALTs printed more TBO Close Shorts yesterday: ADA, HYPE, BCH, SUI, HBAR, SHIB, CRO, ETC, ALGO, PENGU, RENDER, IMX, SPX6900, FTN and SAROS. These are early bullish reversal warnings, and many charts are seeing their second printed this week. 2Z, FLOKI, 0G and VSN all have new TBT Bullish Divergences that should be watched. And I personally think FLOKI will start pushing back higher and pumping again so long as Elon keeps mentioning it, like he did in 2020 with DOGE. BNB, MNT, TWT and BORG printed TBO Close Longs on yesterday's daily candle closes- a bearish reversal warning. PUMP and DASH are still worth watching and paying attention to.
Aaron Dishner102,089 görüntüleme • 7 ay önce

BTC just confirmed the bearish divergence I have been waiting for, and for me that changes the whole map. With BTC now joining the TOTALES warning, I am no longer looking at this as a normal pullback. I think the market is setting up for a much deeper move over the next two months, and that is why I am treating any short term bounce as noise unless price can reclaim key levels with real strength. ETH is starting to crack in the same way. It has not printed the same daily divergence as BTC yet, but the structure is weakening, RSI broke support, and price is losing the fast line. Stablecoin dominance keeps pressing higher, TOTALES has already rolled over, and that combination still points to broad market weakness instead of a healthy reset. TradFi is not helping the bulls either. DXY looks ready for another push higher, USDJPY is back in the danger zone, and if Japan is forced into another intervention cycle the Nikkei, U.S. equities, and crypto could all get hit together again. At the same time, WTI looks overextended after filling its gap, while gold and silver are still chopping without giving me a strong risk-on signal. For today’s picks, I am still leaning toward bearish setups over heroic longs. XRP, QNT, ICP, NEAR, TRUMP, DCR, RENDER, ATOM, CHZ, and MORPHO all still look vulnerable if this broader risk-off move keeps building. A few names like DOGE, SKY, and some smaller caps can still bounce, but for me the bigger message today is simple: the warning signs are stacking up, and I would rather stay patient and defensive than fight the trend. 00:00 BTC confirms the bearish divergence 03:03 ETH weakness and stablecoin dominance 05:25 TOTALES breakdown and market-wide risk 06:54 DXY, USDJPY, and Japan intervention risk 13:41 WTI, gold, and silver check-in 20:12 Altcoin picks and short-side setups
Aaron Dishner19,452 görüntüleme • 1 ay önce

I think May and June could be brutal for crypto, and in this video I walk through exactly why I still believe BTC could push all the way down to $38,555 before this bear market leg is done. The core of the argument comes from the crypto calendar and how the last real bottom years behaved, especially when you compare monthly closes with the full wick-to-wick volatility inside those candles. I break down what those historical averages imply for BTC first, then apply the same lens to ETH and the broader market. The important point is not just that monthly closes could be red. It is that the intramonth volatility can get much uglier than the close alone suggests, which is why a move that looks manageable on paper can still feel like a bloodbath in real time. I also zoom out to TOTALES and the smaller-cap market to show how deep the damage could go if the same kind of bear-market behavior repeats. That is where the opportunity comes in too. If this forecast is even directionally right, the next two months could create some of the best accumulation windows of the cycle, but only for people who stay patient, think probabilistically, and avoid pretending projections are guarantees. The biggest takeaway is that this is a forecast, not a certainty. July has historically looked stronger, but I do not treat that as proof the full bottom is in. Right now I am using the best historical data we have to map the downside, prepare for volatility, and think ahead instead of reacting after the damage is already done. Crypto Calendar: Chapters: 00:00 Bitcoin to $38,555 by June? 01:48 BTC May and June historical forecast 03:19 Bitcoin volatility and lower wick projections 06:40 June could be even worse for BTC 10:47 Why this data comes from The Better Traders Club 12:34 Ethereum May and June forecast 15:30 ETH volatility and the $1,000 target 20:02 What TOTALES shows about the whole crypto market 23:29 TOTALES May and June downside projections 27:04 TOTALES vs TOTALLY50 vs TOTALLY100 explained 31:39 TOTALLY50 forecast and mid-cap risk 34:51 TOTALLY100 forecast and smaller-cap risk 36:21 Why July could bring a bounce 37:40 These are projections, not guarantees 40:02 How traders should prepare 41:48 Trading volatility and final thoughts 🎲 Play Moonin Papa BINGO with today's video: 💹 Take Your Trading to the Next Level! 💰 Sign up & Trade on Kraken 👉 🥇 Toobit: $15k Bonus 👉 🥈 TBO indicator: identify trends early, confirm breakouts, and maximize profits by staying in the trend 👉 📚 Learn Proven Crypto Strategies: Master bot trading, scalping, day trading, and swing trading with our courses: 🌐 Stay Connected: Follow me for market updates and insights across platforms:
Aaron Dishner17,790 görüntüleme • 1 ay önce

Bitcoin dropped to $93k yesterday and also printed a second TBO Breakdown, which is a bearish explosive prediction symbol from the Trending Breakout indicator. It's interesting to see BTC bounce from this level, but the signs are clear on multiple time frames that BTC is looking more and more bearish. ETH also confirmed its first TBO Breakdown yesterday on its daily close. Not to mention it printed a TBO Close Long on the weekly candle too. Now speaking of TBO Close Longs on the weekly, one possible outcome for these signals is that we get an oversold bounce for both BTC and ETH up to the weekly TBO Fast lines. If this happens, the market will feel ECSTATIC for a short period, but given how strong bearish the charts are, there is a strong chance that it will only be a temporary bounce before we see more pain to the downside. To make matters worse, combined stablecoin dominance printed its third TBO Breakout on the daily- the final symbol we'll see for the Breakout cluster. To make matters worse here, weekly RSI is above 75, which means we're more likely to see bullish continuation for this chart- which means more pain for ALTs (bot not all of them). STRK, XMR, ASTER and MORPHO have valid TBO Breakouts on their 4h and daily charts, which means we could see these chart have more explosive upside continuation. LTC, PI and BANANAS31 have new TBO Close Shorts on the daily time frame, which are early bullish reversal signals. Yes, I'm still expecting LTC to pump. The market isn't over until LTC (the fat lady) sings/pumps. ZEC, DASH, NIBI and RESOLV remain strong bullish with the TBO, making these good candidates for further upside continuation. SOL printed a third and final TBO Breakdown on its daily chart over the weekend, and ADA printed a TBO Breakdown Cluster on its 4h chart. These signals warn us of potential explosive downside continuation. TEL, XPL and MYX are worth watching this week due to irregular Volume and price action.
Aaron Dishner62,566 görüntüleme • 7 ay önce

BTC didn't put in a higher high, but RSI finally flipped overbought on Sunday. More importantly, however, combined stablecoin dominance printed a major reversal signal on last week's candle close. This alone is making me second guess crypto- if it weren't for the growing bearish sentiment from TradFi... Lots to unpack today.
Aaron Dishner31,782 görüntüleme • 3 ay önce

WOW! Bitcoin not only broke above overhead resistance in our bull flag, it also took out the next three resistance fan levels! This is a HUGE BULLISH signal for Bitcoin and crypto. Uptober is definitely here! Now, the reality of this move is that the combined stablecoin dominance chart is at critical short term support. If BTC has a slight pullback today, that will cause stablecoin dominance to bounce off of support, which will validate that level of support and cause a wider market pullback (even though it should just be minor). Secondly, the TOTALES daily chart is also right at resistance today. If it can break ABOVE resistance, then we'll see combined stablecoin dominance DROP LOWER, which is EXACTLY what we want to see in order for more bullish continuation. Lots of charts are having incredible TBO Breakouts right now, showing me that there is more bullish explosive upside continuation possible for IMX, ZEC, SNX and FLR. ADA, APT, QNT and HNT all have valid TBO Close Shorts, which are my FAVORITE bullish reversal signals. BCH, LTC, AAVE, MNT, XDC and PUMP all look massively bullish to me. NEAR and SOL both "closed" their TBO Close Longs, but I'm still avoiding NEAR for now. ALPINE had a MASSIVE pump and dump, losing over 70% yesterday 💀 BLUE, DASH, XRP, XLM, SUI, SHIB, XMR, SPX6900 and S are all worth watching closely today too. But my main concern lies with the fact that several "OG" coins like DASH, ZEC, LTC and XMR are pumping- which is typically a sign that we're at the start of an ALT rally. While this is great news, I'm cautiously watching these signs, and so should you!
Aaron Dishner64,617 görüntüleme • 8 ay önce

BTC is down over 3.5% on Wednesday's daily candle close. Eight green candles in a row was manipulation. We had our pivot high on March 17th - the bear flag has resolved. Next pivot low is likely $65K-$67K. After that, the support break, retest as resistance, and we go lower. Based on previous drawdowns of 84% and 77%, a 70% drop from $126K lands around $37K-$38,555 - lining up with our artificial supports. Bear markets have lasted 52-54 weeks. We're still a couple of months out. RSI confirmed the reversal with a lower high at 76.83 versus January's 82.07. BTC wicked into the fast line and risks closing back below the cloud - that flips us from bullish consolidation back to strong bearish. ETH took a 5% close with RSI reset from 84 Monday to 57 Wednesday. ETHBTC is overbought at resistance - underperformance trade stays on. Stablecoin dominance RSI reset below 23.33 on Monday. Check please. DXY hit 100.314 and RSI flipped - dollar may be weakening, which should help stocks. The yen is the real danger: second TBO breakout on Wednesday, confirmed bearish divergence. If it keeps weakening, it tanks everything. VIX back in the rejection zone. S&P, Dow, Nasdaq all still strong bearish. Gold dumped 3% and printed a TBO close long in bearish consolidation - choppy May 2025 replay. Silver has two 4H TBO breakdowns. Copper confirmed a TBO open short. HYPE, Kaspa, QNT, Fartcoin, River all have TBO breakouts - Kaspa the cleanest setup, up 25%. BNB, PEPE, Bonk, and Fluid pulled back to the fast line after TBO close shorts Sunday - that's the entry window. TAO is overbought for day nine with two TBT bearish divergences. Fetch short still open. Pippin down 75% on the week. Merlin down 12% with a TBO breakdown cluster. XRP, Solana, Doge, Render, Trump, Syrup, and Zero all have 4H TBO close longs. Siren up 94% off the springboard bounce. Monero working on a second weekly TBO close long - very bearish. SoFi showing bullish divergence on the daily. Circle pushed above the 0.5 fib - next target $150.88. Western Digital TBO resistance jumped from $294 to $319 - strong bullish.
Aaron Dishner24,611 görüntüleme • 2 ay önce

BTC pushed above the TBO cloud over the weekend and is technically strong bullish in the short term, but Aaron’s core message today was still caution. Volume remains weak, the Slow line is still macro bearish, and RSI is putting in lower highs while price stalls just under 80K. Even with OBV still technically bullish, this move does not yet look strong enough to change the bigger bearish view. ETH looks even weaker than BTC here. It bounced, but it still has not cleanly cleared overhead resistance, RSI continues to trend lower, and volume plus OBV both look fragile. Aaron is still expecting a lower low on ETH, and that fits with the broader setup where BTC is holding up better than the rest of the market. The bigger macro warning signs are still in dominance and risk sentiment. BTC.D remains very strong, stablecoin dominance looks ready to push higher, and TOTALES plus OTHERS/BTC still look vulnerable to rejection. If stablecoin dominance rises while BTC.D stays firm, alts are likely to keep getting punished even if BTC itself only pulls back modestly. TradFi is also flashing risk-on excess while Aaron stays skeptical. DXY looks like it could bounce, USDJPY remains important after Japan intervention talk, GameStop pumping again is a sign of greed, and oil still looks strong while gold and silver stay mixed. On the watchlist, Aaron leaned bearish on names like XLM, NEAR, ICP, ARB, RENDER, DEXE, PENGU, MON, and AERO, while stronger charts like DOGE, HYPE, and MORPHO still look impressive but increasingly suspicious if momentum keeps fading. Chapters: 00:00 BTC above the cloud but still lacking conviction 03:10 ETH looks weaker than BTC 06:13 BTC dominance and stablecoin dominance warnings 10:42 TOTALES and OTHERS/BTC rejection risk 12:50 DXY, USDJPY, and stock market risk sentiment 16:57 Oil, gold, and silver check-in 18:56 TRX, ZEC, TAO, ONDO, and H 22:55 XLM, WLFI, NEAR, ICP, ARB, and ZRO 27:12 DEXE, PENGU, MON, and AERO 31:17 DOGE, HYPE, XMR, ALGO, MORPHO, and viewer picks 34:22 Final outlook for May and June
Aaron Dishner13,181 görüntüleme • 1 ay önce

BTC closed green again on Thursday, but I still read this market as caution, not confidence. The lower wick to $73,309 helped the candle, but daily RSI pushed overbought at 70.76 while printing lower highs than both April 11 and March 16. That keeps BTC pinned under what I’m now calling iron fortress resistance, while spaghetti support looks increasingly fragile. On the 4-hour, I still do not see the clean bearish reversal signal I would normally want, and that is exactly why this price action feels so weird to me. Price looks propped up, not strong. Ethereum is showing the same kind of weakness. ETH has now spent five straight days failing to close above TBO resistance at 23.76, and I still think a pullback toward the Fast line near 22.26 makes more sense than a clean breakout. At the same time, BTC dominance dropped hard, stablecoin dominance also moved lower, and alts exploded across the board. Normally that would sound bullish, but this move looks too aggressive and too suspicious for me to trust. OTHERS, TOTALE50, and TOTALE100 all ripped higher in a way that feels more like rotation, short squeezing, or outright exit-pump behavior than healthy trend continuation. TradFi is not making me feel any safer either. DXY confirmed a pivot low and now looks ready to move higher toward the open gap, which would add more pressure on USDJPY and keep macro conditions hostile. ES futures printed a fresh all-time high, the Nikkei also pushed higher, and Tesla ripped, but volume has been fading on the move, which makes the rally look unstable to me. Oil still has an upside gap that may need filling, gold is chopping inside the cloud, and uranium just broke out above its bull flag. On my watchlist, I’m focused on the charts that pumped hardest into resistance and now look the most vulnerable if this move fades, including XRP, BNB, SOL, LINK, SUI, ENA, LDO, INJ, FIL, AAVE, PENGU, PUMP, VIRTUAL, ADA, APT, HYPE, Binance Life, RAVE, Monad, Render, CHZ, XLM, SIREN, CFX, ZBCN, PIPPIN, and WAL. My main takeaway today is simple: this market is moving in a very weird way, and in a bear market I would rather respect the macro trend and take profit on suspicious pumps than assume this is the start of a clean breakout.
Aaron Dishner13,815 görüntüleme • 2 ay önce

BTC is showing the textbook signs of a pivot high. RSI confirmed overbought and reversed in a single day - the last time we saw a one-and-done RSI move like this was back in January before a meaningful pullback. OBV's moving average is still pointing up, which keeps the door open for one more push to around $77K, but the bear flag has been fulfilled. Higher lows and higher highs are done. We can go home. If BTC does put in a higher high from here, I'd expect to see a lower high on RSI - that would just reinforce the setup. Support sits around $65K-$67K, and based on the pace of the last drawdown, something like that by end of weekend isn't unreasonable. Ethereum held up stronger than BTC this week, with RSI staying overbought across three days - Sunday at 73, Monday at 84, Tuesday at 76. ETHBTC is right at resistance. The multiple factor effect means whatever BTC does, ETH does 1.5x to 2x. Ethereum could still push higher, but we're deep into risky territory. Stablecoin dominance flipped green after eight consecutive red days. RSI confirmed oversold on Monday. The trend is starting to shift, and when this chart pumps it typically corresponds to selling pressure across crypto. DXY closed below support from Friday's push after going overbought on the 13th. RSI cracked below 61.78. A pullback to 98.708 is on the table, which should bring some relief to the euro and yen. The yen is still dangerously overbought - second TBT bearish divergence now printing on the weekly. If it keeps pushing up, the Bank of Japan's hand gets forced. We all know what happened last time that went too far. VIX is still inside the rejection zone it's been in since March 2023. Fear hasn't left the building. S&P futures have a TBO close long on the weekly - same pattern that printed before a 16% drop. NVIDIA's daily cloud is now compressed to under 1%. When the cloud gets that tight, explosive moves follow - not necessarily up. On the picks side: XRP had a real volume spike and an 8.8% move after 4H TBO breakouts, but I'm not convinced the momentum holds. Solana's OBV moving average is genuinely bullish - one more leg is possible. Tron is the biggest surprise - perfect three-in-a-row TBO breakout cluster and a 4% move, which for Tron is wild. HYPE printed a second TBO breakout with RSI at 82.34 - the level to beat is 83.86. Kaspa RSI hit 91.5 after a 9% move - that's danger territory. TAO has been overbought on the daily RSI since March 11th - day eight. OBV is genuinely bullish but the warning signs are piling up. Walrus protocol jumped 24% out of nowhere - probably news related and likely AI adjacent. Pippin is down 31% on Tuesday's close. Pi Network is now down 39% from its high after a textbook RSI divergence setup played out exactly as expected. Bitcoin Cash printed a TBT bearish divergence. Render, Morpho, Fetch AI, Syrup all showing exhaustion signals on the 4H.
Aaron Dishner16,640 görüntüleme • 3 ay önce

BTC is up 3% on the Jane Street news. Yes, it's worth celebrating. But BlackRock accumulates BTC and moves entire markets without anyone blinking. Manipulation in crypto isn't new. This is not the bottom. BTC is still a deeply bearish chart. The bear flag is still valid. We lost support two days ago, bounced, and are now testing it as resistance. Pivot low at $62,510. Fast line at $69K — a realistic target if this bounce has legs. But the slow line still says lower. Targets: $49K → $38,500 → $31K. Not buying until I see capitulation — long lower wick weekly with volume. Not there. ETH up 3.3%, pivot low at $1,800. Bear flag still valid. TBO resistance at $2,050, then $2,200 would fool a lot of bulls. Volume not showing capitulation. Stablecoin dominance wicked to 12.05%, TBO breakouts printed — macro is bullish on every timeframe, expecting higher. Others dominance TBT bearish divergence confirmed Sunday, unconfirmed today with 22 hours left. Total market cap up 3.16% but TBO breakdowns on the 4h. Still not capitulation. TradFi: the DXY printed a second TBO close short — last seen July 2025. Rising dollar means pain for stocks. NVDA, Tesla, Dow all weak. VIX confirmed a TBT bearish divergence — first since October 2023, 75% historically marks a VIX top. Could see an equity relief rally if it plays out. Gold held the 618 Fib, still targeting $5,451 then $6,500. Alts: XRP, SOL, LINK, SUI, LTC, AVAX all have TBO breakdowns. PIPPIN up 79% in 3 days — stopped me out but RSI lower highs on the daily are a warning. POL has a TBO close short — wait for the fast line, don't chase. MYX second TBO breakdown — oversold pump possible, macro still brutal. MORPHO pushing higher — RSI needs to exceed 81.65 for continuation.
Aaron Dishner18,902 görüntüleme • 3 ay önce

Bitcoin is extremely close to having a final capitulation sell-off based on the May 2022 fractal, but what does that mean for the rest of 2026? Will Bitcoin bottom out in October, 52 weeks after topping out, just like it did in November 2022 and December 2018? And could the S&P actually cause BTC to go lower if it crashes here (like I've been expecting it to this year)? It's time to buckle up for the last leg down for BTC in this Bottom year.
Aaron Dishner19,084 görüntüleme • 3 ay önce

BTC over $110k feels great, but it has me wondering- what will $150k feel like? 😂 But seriously, price action and Volume look great for BTC, and I expect it to continue pushing higher over the next 30-40 days. The main thing we need to keep an eye on during this pumping period for BTC is how Bitcoin Dominance (BTC.D) reacts. I suspect BTC.D will increase along with BTC initially, but once BTC starts topping out or pausing, BTC.D will start to fall and degens will ape into ALTs. I share several to keep an eye on, including MKR, PENDLE, APT, POL, RSR, and more.
Aaron Dishner30,297 görüntüleme • 1 yıl önce

Markets love giving hope right before they take it away. BTC inside the TBO cloud, volume barely above average, bear flag still intact. My targets haven't changed: $60K → $49K → sub-$40K accumulation zone. The macro trend hasn't changed just because of one green day.
Aaron Dishner11,067 görüntüleme • 3 ay önce

Today EVERYTHING is focused on the OTHERS chart and dominance levels, and a MAJOR SHIFT in favor of OTHERS that has preceded EVERY MAJOR ALT RALLY. OTHERS.D printed a TBO Close Short confirming a bullish recovery in progress, along with TOTALE50.D and TOTALE100.D. This massive shift in dominance is HUGE because Bitcoin Dominance printed a TBT Bearish Divergence yesterday- just like it did BEFORE EVERY ALT RALLY. But the JUICIEST charts are the OTHERS/BTC and TOTAL3ESBTC charts, which printed TBT Bullish Divergence Clusters on the daily and TBO Close Shorts! This is the start of a BULLISH RALLY for ALTs that is way over due. My original prediction for crypto was for BTC to top out in mid-November and for ALTs to rally up until mid-December- so it looks like my second prediction might be playing out! But don't get too confident here! This is most likely the LAST ALT Rally before the bear market begins, just like in late 2021 and late 2017. TONS of coins remain strong bullish and breaking out with TBO Breakouts: ICP, SCRT, MINA, BARD, DUSK, AR, AIA, ROSE and NIBI. TONS of charts are showing early bullish reversal signals with TBO Close Shorts: RVN, FIL, 1INCH, MNT, STRK, TRB, DOT, ETC, CHR, NEO, RARI, LINK, VELODROME, KAITO, IP, STORJ and MOVR. TONS of chart are showing bullish strength growing: MNDE, SLM, GAS, GLM, CBK, API3, BIO, RLC, W, KAS, XPL, NEAR, BDX, ZEC, H, TRVL, FUN, CRV, GAME, S, PYTH and ASTER. Only four charts are looking bearish right now to me in the short term: DASH, RIVER, JELLYJELLY and TAO. Keep a close eye on COAI, LTC, EAT, 2Z, USELESS, FET, UXLINK, BTRST and HOPR. Especially LTC!
Aaron Dishner13,863 görüntüleme • 7 ay önce

Daha fazla içerik yok.