

Shelpid.WI3M
@Shelpid_WI3M • 53,489 subscribers
Bringing you the latest trends in #crypto 🔊
Shorts


Videos

🚨 I WARNED YOU. A BIG STORM IS COMING!! Everyone's staring at red numbers this week. Almost nobody's noticing the thing that actually matters: they're all red at the same time. Korea down 10% in a day. Japan, Europe, US futures all sliding together. Crypto rolling over. Gold off its highs. Different countries, different asset classes, different stories… one direction. Here's what that means, in plain terms. In a healthy market, things disagree. Stocks zig, bonds zag, gold does its own thing - because each is pricing its own reality. But when everything starts moving as one block, that's not a bunch of separate markets anymore. That's a single, giant, leveraged bet wearing a hundred different tickers. And we've seen what happens when that bet unwinds: → 2008 - correlations went to 1, and "safe" and "risky" fell together. Nowhere to hide. → 2020 - every screen turned red in the same week, until the Fed flooded the system. → Right now - the same convergence is showing up again. Quietly. Across borders. When markets fuse like this, individual analysis stops working. You're no longer holding "stocks" and "crypto" and "gold." You're holding one trade - and it only takes one shove to move all of it at once. Look underneath the surface and the pressure is obvious: → Bond yields flashing stress → Liquidity tightening in the background → A Fed boxed into a corner - ease and reflate the bubble, or tighten and crack an overextended market Either path leads to the same place. Something breaks. That's the part people miss. A crash doesn't announce itself with one scary headline. It announces itself when correlation goes to one - when the market stops being a market and becomes a single, fragile thing that all moves together. That's what just started this week. Most people will call it "a normal pullback" right up until it isn't. I've spent 10 years watching turning points form, and this is exactly how they look from the inside. When everything moves as one, the only question left is which way and this week, it picked down. Don't be the last one still treating it like business as usual.
Shelpid.WI3M3,181,183 просмотров • 3 месяцев назад

🚨 A CHART FROM 1875 PREDICTED THIS EXACT YEAR. LOOK AT YOUR SCREEN. Three indices. One blow-off top. All curling over at the same moment - exactly on the year a man circled in pencil 150 years ago. His name was Samuel Benner. He wasn't a banker, a quant, or a Wall Street prophet. He was an Ohio pig farmer who got financially wiped out in the Panic of 1873 - and was so haunted by it that he spent the rest of his life trying to figure out why markets boom and bust on a clock. In 1875, he published his answer: a hand-drawn chart labeling every future year as one of three things - panic, good times, or hard times. "Good times," in his words, meant high prices and the time to sell. He mapped it all the way to 2059 - and never lived to see almost any of it. Here's the uncomfortable part: his chart has shadowed the big ones for 150 years - the 1929 crash, the dot-com top, 2008. People keep laughing at the dead farmer right up until they're not. So look at what his chart says about right now. 2026 is a "good times - SELL" year. Now look at your screen again. Not one index - three. The Russell 1000, the S&P 500, and the Nasdaq 100. Large caps, the broad market, and big tech, all spiking to the same peak and rolling over together. That's not a sector wobble. That's the entire U.S. market topping at once, on the exact year the farmer flagged before electricity was even in homes. Do I think a 19th-century pig-iron cycle secretly governs Nvidia's stock price? No. The honest take is that Benner's chart has misfired before, and "a calendar told me so" is a terrible reason to sell anything. But here's what makes 2026 different from every other time this chart got hyped: this time the fundamentals showed up to the party. Valuations last seen at the dot-com peak. A Fed that's turned hawkish into sticky inflation - not cutting, threatening to hike. A tech rally so narrow it cracks the second the AI story blinks. And a market that just watched a major economy fall 10% in a single day this week. The farmer didn't predict any of that. He just happened to circle the year the math finally caught up with the mania. You don't have to believe in the chart. You just have to notice that the chart and reality are pointing at the exact same door - and everyone's still walking in. When the superstition and the spreadsheet agree, that's the one time it's worth looking up.
Shelpid.WI3M2,960,107 просмотров • 3 месяцев назад

🚨 WARNING: A BIG STORM IS COMING The Fed just dropped new macro data, and it's worse than anyone expected. If you're holding assets, you're not going to like what comes next. A systemic inflation problem is quietly building under the surface. Almost nobody is positioned for it. Because the Fed is out of good options: → Headline PCE inflation jumped to 4.1% → Core PCE stuck at 3.4% → The Fed's target? Just 2% And the economy isn't rolling over to force their hand: → Manufacturing PMI at 53.3 → New orders at 56.0 → Services employment back in expansion That's not healthy growth. That's a strong economy with accelerating inflation. Which gives the Fed zero reason to cut, and every reason to hike. Now the problem nobody wants to talk about: U.S. debt just passed $39.84 trillion, rising faster than GDP. Interest payments alone are exploding into one of the biggest costs in the entire budget. The government is now issuing new debt just to pay interest on old debt. That's a **debt spiral.** And that's the trap. You can't sustain record debt when rates rise. You can't run trillion-dollar deficits with inflation double the target. Something has to give. We've seen this exact setup before: → 2000, before the dot-com collapse → 2008, before the financial crisis → 2020, before the repo market seized The Fed is cornered. Reminder: I've called the major tops and bottoms for years, including the $16K Bitcoin bottom and the $126K top. When I exit the markets completely, I'll post it here, like always. Turn notifications on. If you're not following yet, you'll understand why soon enough.
Shelpid.WI3M1,410,010 просмотров • 2 месяцев назад

🚨 THIS PATTERN HAS NEVER FAILED… Every 4 years, right after the U.S. market opens in July's Monday... The S&P 500 gets hit HARD. 13 Jul 1998 → -24.95% 8 Jul 2002 → -32.86% 10 Jul 2006 → -11.58% 12 Jul 2010 → -19.01% 14 Jul 2014 → -14.63% 9 Jul 2018 → -23.17% 11 Jul 2022 → -28.81% 16 Jul 2026 → -**.**% The next date is here. And history is following the same script again. This is NOT a random seasonal move. It has repeated for almost 30 years. Every time, investors believed the worst was over. Every time, the real correction came next. People will say: "This time is different." They always do. Monday could mark the beginning of the next major leg down. Follow and turn notifications on. I'll post the warning BEFORE it hits the headlines.
Shelpid.WI3M1,930,605 просмотров • 3 месяцев назад

🚨IF THIS HAPPENS, MONDAY COULD BE A BLOODBATH And most people aren't ready for it. Two straits. 25% of the world's oil supply runs through them. This isn't a temporary supply disruption it's a structural break in the energy system the entire global economy was built on top of. And oil keeps pumping every time the U.S. and Iran trade blows. It's already ripped above $100 a barrel. Just sit with that number. Here's what rising oil actually does. It doesn't just raise gas prices. It raises the cost of making, shipping, and growing everything. Every product manufactured, packaged, and delivered has an energy cost baked in. When oil moves, all of it moves quietly, with a lag until it all lands in the same inflation print at once. And that print kills whatever rate-cut hope was still alive. The Fed was already hiking into a slowing economy. Now they're hiking into a supply shock with no end date. That combination has a name. It was last seen in the 1970s, and it ended careers, governments, and decades of prosperity: STAGFLATION. High inflation, stagnant growth, a central bank with no good options only two bad ones. Cut, and inflation explodes into a broken energy market. Hike, and you crush an economy already buckling. There's no third choice. No policy tool built for two blocked straits at once. Now stack everything already broken on top: → AI bubble deflating → Strategy selling Bitcoin at a loss → Japan dumping Treasuries → MSTR down 81% → SpaceX unlocks hitting in weeks → The S&P held up by eight stocks that are already cracking Every one of those was a problem before oil moved. Rising energy makes all of them worse at the same time - margins compress, earnings miss, and valuations sitting at 100-year extremes have zero room to absorb it. Stocks, bonds, crypto, real estate everything priced for a soft landing reprices for the exact opposite. Oil doesn't need to hit $150 to break things. It just needs to stay high long enough for the math to catch up to the prices. This sounds scary, but I'll keep you updated here. When I rotate money, I'll post every move. Many will regret not following sooner.
Shelpid.WI3M1,671,315 просмотров • 2 месяцев назад

🚨 IF THIS HAPPENS, MONDAY COULD BE A BLOODBATH. WARNING: TOMORROW COULD BE THE WORST DAY OF 2026!! Japan just hit the panic button, and almost nobody understands what it means yet. → Over ¥15.1 TRILLION in bond losses → Japanese bond yields exploding to all-time highs To cover the damage, the BOJ is offloading a massive wave of U.S. Treasuries. If you own any assets, read this twice. Because the biggest carry trade in history is starting to unwind. For decades, Japan pinned rates near zero. That made the yen the cheapest money on Earth. Investors borrowed trillions of it for almost nothing, then poured it into U.S. Treasuries, stocks, real estate, and crypto worldwide. That trade was the plumbing underneath global asset prices. And now it's breaking. Japan is drowning in debt, an aging population, and enormous pension obligations. So policymakers want that money home, by any means necessary. They've already started. The BOJ is pushing pension funds toward Japanese assets. GPIF alone, the largest fund on Earth, manages over $1.8 TRILLION. Shift even a fraction, and hundreds of billions flow out of global markets. And rising Japanese yields only accelerate it. The higher they climb, the more attractive it is to keep capital at home, and the more pressure builds on everything that was funded by cheap yen. Here's the chain reaction: → Japanese money comes home → Foreign assets get sold → Treasury yields rise → Liquidity disappears everywhere That's how stress spreads. Quietly at first. Then all at once. Most people won't grasp why markets are unraveling until it's already happening. I've studied these cycles for over 12 years and called nearly every major top and bottom. If you want to survive the 2026 cycle, follow and turn notifications on. I warned you before. I'm warning you again now. A lot of people are going to wish they'd listened sooner.
Shelpid.WI3M967,370 просмотров • 2 месяцев назад

🚨 THE 100-YEAR CYCLE IS ABOUT TO BREAK For a hundred years, the S&P has run the same rhythm. Roughly 25 years up, then 9 to 12 down. It's repeated so often people treat it like gravity. That's why everyone's staring at the chart swearing the bull has years left. And historically, they'd be right. But this cycle breaks the pattern. Here's why. Every long bull run was powered by a technology that took decades to price in. Railroads. Electricity. The internet. The market grew into each story slowly. AI didn't get years. It got repriced in about 24 months. That's the whole problem. A move that used to take a generation happened in two. There's nothing left to grow into. Just price sitting on air. And the warning lights are already flashing: → Valuations at 100-year extremes → Smart money heading for the door → Distribution across the tape → Insiders dumping their own stock → Buffett sitting on record cash → Burry calling this a rerun of 1999 A 25-year cycle needs a catalyst that lasts 25 years. This one already burned itself out. I'm not saying this to scare anyone. I've watched these turns before, and they always look the same. Obvious in hindsight. Mocked in the moment. When the real move comes, it won't wait for the crowd to agree. Follow now, notifs on. Be early instead of surprised.
Shelpid.WI3M454,879 просмотров • 1 месяц назад

🚨THE SPACEX SETUP JUST TURNED DANGEROUS SpaceX is back at $140. Up 25% in two days. And it ripped higher right after 911.5 million shares became eligible to sell. On the surface that makes zero sense. More supply should mean lower prices, not a rally. But look one level deeper and it clicks. Before the unlock, roughly 34% of the entire float was already shorted. Everyone saw Aug 6 coming and piled into short positions early, betting on the dump. So when the crash didn't hit right away, those shorts got nervous and started covering. That covering is what pushed price up. Retail saw green candles and started chasing. Now the crowd thinks the danger has passed. They're walking straight into the next trap. Here's the thing nobody wants to sit with: insiders didn't lose the ability to sell. Those 911.5 million shares are still unlocked. The supply is still sitting there, waiting. And more unlocks are stacking up behind it. My plan hasn't changed one bit: Fake bounce from $105 to $125 → done First 20% supply unlock (911M shares) → done Retest of resistance → happening now Flush below $100 → next Final flush into the $77 to $85 zone → after that I'm not touching this $133 pump. I'm waiting for the $85 area to start building my position, when the supply is exhausted and the sellers finally run dry. Reminder: I've called the major tops and bottoms for years, including the tops in gold and silver, the collapse in oil, the SpaceX drop, and Bitcoin's crash. All before they happened. When I start buying SpaceX, I'll post it here publicly, like always. Turn notifications on. If you're not following yet, you'll understand why soon enough.
Shelpid.WI3M314,902 просмотров • 2 месяцев назад

🚨THE GLOBAL COLLAPSE IS ALMOST HERE For a full century, the S&P has moved to the same beat: roughly 25 years up, then 9-12 years down. It's repeated so many times that people treat it like a law of nature. And that's exactly why everyone's staring at this chart insisting the bull still has years left. The logic isn't crazy historically, they'd be right. But this time I think the pattern breaks, and the reason is simple. Every one of those long bull runs was powered by a technology that needed decades to fully sink into prices. The railroad. Electricity. The internet. The market got to grow into each story slowly, over years. AI didn't get years. It got repriced in about 24 months. That's the whole problem. The move that used to take a generation happened in two years which means there's nothing left to grow into. Just price sitting on top of air. And the warning lights are already on: → Valuations stretched to levels not seen in 100 years → The smartest money in the room heading for the door → Distribution showing up across the tape → Insiders quietly selling their own stock → Buffett hoarding the biggest cash pile of his life → Burry openly calling this a rerun of 1999 A 25-year cycle needs a catalyst that lasts 25 years. This one already spent itself. I don't say this to scare anyone I say it because I've watched these turns before and they always look like this: obvious in hindsight, mocked in the moment. When the real move comes, it won't wait for the crowd to agree. It never does. Follow now, notifs on so you're early instead of surprised.
Shelpid.WI3M333,348 просмотров • 2 месяцев назад

This self-evolving trading system kills 97% of its own strategies It's called SETS Machine. Nobody writes its strategies. It breeds them, tests them and kills them by itself Observe → hypothesize → mutate → backtest → select → deploy. Then again. Every 5 seconds Each strategy is a grid bot with 8 genes: entry logic, lookback, entry threshold, grid levels, spacing, size multiplier, take-profit, stop Every generation: 96 strategies. 8 random newcomers get injected. 80 offspring are bred from the strongest parents. Everything gets backtested on real BTC candles Then comes the part most "AI trading bots" skip Every strategy has to survive data it has never seen. It trains on 70% of the history and gets judged on the last 30%. Lose money there, draw down more than 10%, or win less than half your trades, and you're dead Only the elite live to the next generation. Everyone else is buried Four species compete at once: momentum, mean reversion, volatility breakout, range grid. Quotas stop one lucky species from wiping out the others The winner gets hot-swapped into a paper-trading grid, sized by Kelly. You watch every fill, every take-profit, every stop in real time This is the loop quants get paid $650K a year to run: take an idea, test it on history, kill it if it doesn't work, repeat Here it never stops No PhDs. No team. No servers And it's fully open source. Engine, backtests, dashboard, tests. No API keys, no build step. It runs right in your browser Click any strategy in the gene pool and see its DNA. Change the seed and grow a completely different evolution It even shows you honestly where it loses to buy & hold. Because a system that hides its losses isn't worth running GitHub:
Shelpid.WI3M119,969 просмотров • 27 дней назад

🚨 NO WAY… $500K profit with Clawdbot and Polymarket, all automated This is NOT bait and it’s not made up. If you trade on Polymarket, you NEED to see this. He started small, built a fully autonomous system, and scaled it into a machine generating ~$500K in profit No insider access No ties to Trump or Musk Just a developer who integrated moltbot (clawdbot) directly into Polymarket Profile → Copytrade → I reviewed his setup and ngl, it caught me off guard No hype strategies No discretionary trading No human intervention at all The entire system runs fully autonomously His FULL strategy: 1. 15-minute BTC & ETH micro arbitrage The bot trades short-duration Bitcoin and Ethereum markets with 15-minute resolution. Within these fast markets, it exploits moments where YES + NO temporarily price below $1. By integrating moltbot (clawdbot) directly into Polymarket, the system captures these gaps instantly, without prediction or bias 2. Automation over reaction When volatility spikes and emotions take over, the system executes mechanically. No hesitation, no latency, no human delay. By the time most traders react, the inefficiency is already gone 3. Scale through autonomy Each trade earns cents, not dollars. But full automation allows nonstop repetition at massive frequency, with zero fatigue Scale matters 29,256 trades executed, each insignificant on its own. Stacked together, they compounded into nearly $500K in profit Bottom line IMO, there’s a quiet bot war unfolding on Polymarket Manual traders argue setups Machines exploit structure And as long as inefficiencies exist, autonomous systems will keep printing.
Shelpid.WI3M985,887 просмотров • 8 месяцев назад

🚨 SPACEX IS DONE? It opened at $150, ripped to $225 in three days, and everyone called it the buy of the decade. Now it's at $145 - an all-time low, below the open, sitting a few dollars above the IPO price. Down 35% from the top. The chart isn't breaking. It already broke. And this was the easy part. Here's where it goes from here: $145 → $135 → $120 → $100 Why this has to happen the math is brutal and public: → Only ~4% of shares actually trade. Nasdaq bent the float rule just to let this listing through. → It got jammed into the indexes, and every passive fund on the planet was forced to buy near the top. → Insiders still hold 96% of the supply. → The first unlock hits on August 6 - right at Q2 earnings. About 20% of insider shares go free, and the float doubles overnight. → Then it doubles again through the fall, all the way to a full unlock. Sit with that. This entire 35% collapse happened on a tiny float, with no supply. The actual wall of stock hasn't even arrived yet. And look at the backdrop: Apple's printing new all-time highs while SPCX bleeds to fresh lows. That's not a market problem that's a SpaceX problem. The hype died, the capex is enormous, the valuation is priced at ~100x sales, and the unlock cliff is dead ahead. Everything I said would happen is happening. No surprises. The next leg is where the real money gets made but not on the long side yet. Save this. Turn on notifications. Or come back in 30 days wishing you had.
Shelpid.WI3M356,362 просмотров • 3 месяцев назад

🚨BREAKING… the smartest 5m & 15m Polymarket Clawdbot setup just went public This is NOT bait and it’s not fabricated. If you’re trading on Polymarket, you NEED to pay attention to this. He began with a small base, engineered a fully autonomous system, and turned it into a machine producing ~$610K in profit No insider advantage No connections to Trump or Musk Just a developer who connected moltbot (clawdbot) straight into Polymarket Profile → Copytrade → I analyzed his setup and ngl, it genuinely surprised me No hype-driven playbooks No discretionary decisions No human input whatsoever The entire operation runs on full automation His FULL strategy: 1. 5 & 15-minute BTC, ETH & SOL micro arbitrage The bot operates in short-cycle Bitcoin, Ethereum and Solana markets with 5 & 15-minute resolution. In these fast environments, it takes advantage of brief moments when YES + NO combine below $1. By wiring moltbot (clawdbot) directly into Polymarket, the system locks in those discrepancies instantly - no forecasting, no bias 2. Automation over reaction via clawdbot When volatility jumps and emotions escalate, clawdbot executes mechanically. No hesitation, no lag, no human delay. By the time most traders respond, the inefficiency has already disappeared 3. Scale through autonomy Each execution captures cents, not dollars. But total automation enables continuous repetition at high frequency, with zero exhaustion Scale is what matters 34,117 trades placed, each trivial alone. Together, they compounded into over $610K in profit Bottom line IMO, there’s a silent bot battle happening on Polymarket Manual traders debate entries Algorithms exploit structural edges And as long as inefficiencies remain, autonomous systems will keep printing
Shelpid.WI3M780,708 просмотров • 8 месяцев назад

🚨WARNING: SOMETHING TERRIBLE IS COMING The biggest liquidation event of the decade is lining up right now and almost nobody's positioned for it. Don't let this rally fool you. The green you're seeing isn't strength it's the trap. The last push up that pulls everyone back in right before the floor gives way. It always looks the most bullish right before it breaks. Look at the pattern: → 2020 → −35.46% → 2022 → −27.13% → 2024 → −20.99% → 2026 → −??% Same cycle. Same setup. Every time. By the time everyone realizes the market is actually crashing, it'll already be too late to do anything about it. That's how these things work they don't send an invitation. They lure you in with one final rally, then pull the rug. Keep in mind: I publicly called the 2022 crash before it happened. Then I publicly called Bitcoin's $126K top in 2025. Both in advance. Both on record. The next call gets posted here first. Follow and turn notifications on.
Shelpid.WI3M224,196 просмотров • 2 месяцев назад

🚨EVERYTHING IS GOING EXACTLY AS I SAID The first big unlock hit. And instead of dumping, $SPCX went from ~$108 to ~$140. But here’s what I think people are missing: The market absorbed the first wave of selling That doesn’t mean the unlocks are finished More supply is coming over the next few months Early holders still have plenty of chances to sell into strength So I’m not chasing this move. The question isn’t whether $SPCX can pump after an unlock. It clearly can. The real question is whether demand can keep absorbing all this supply. I don’t think it can. That’s why I’m still watching the $80-95 zone for a deeper flush before the real bottom.
Shelpid.WI3M208,934 просмотров • 2 месяцев назад
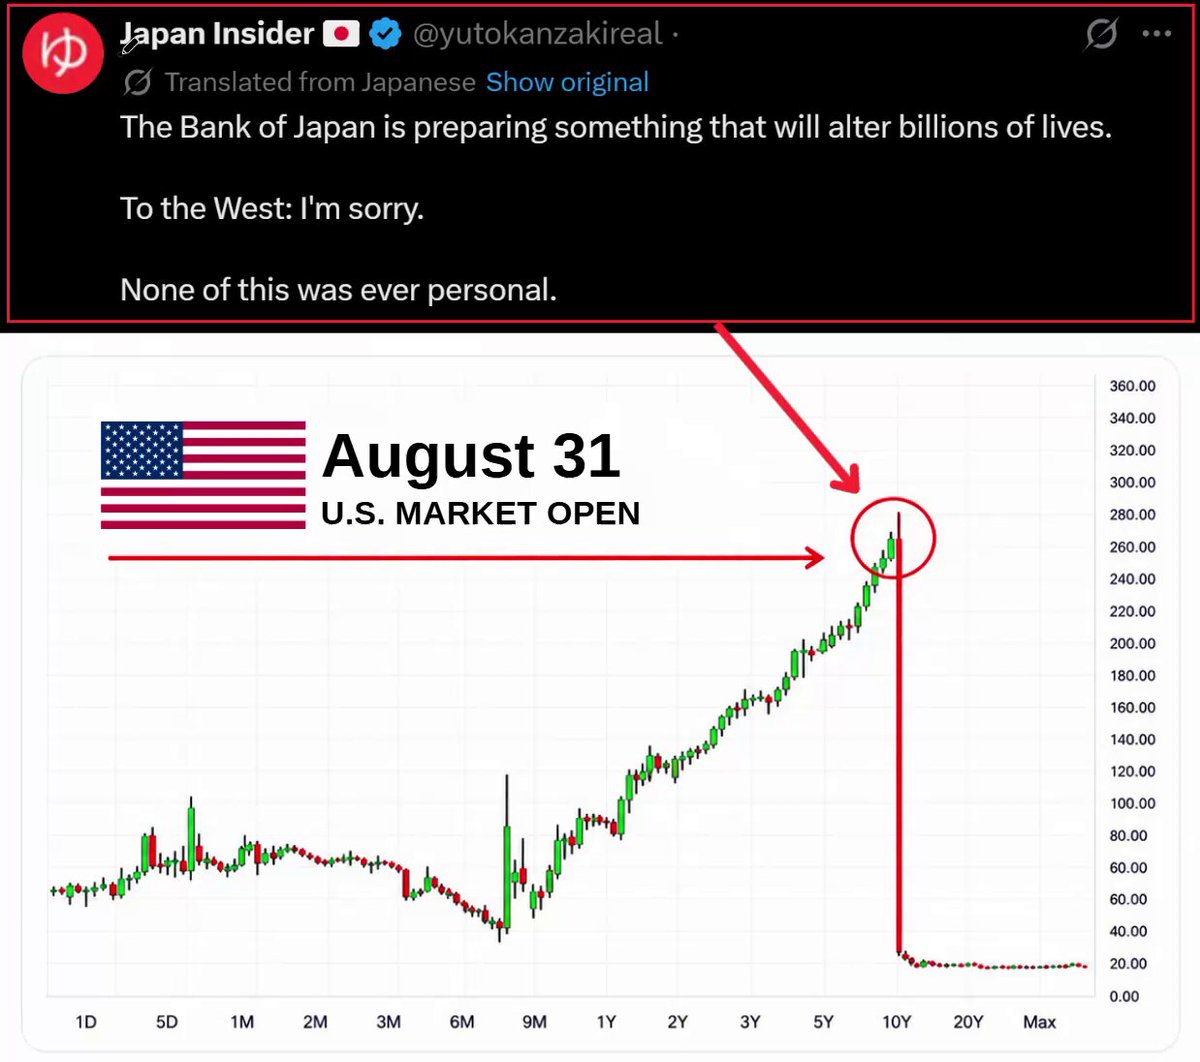
🚨WARNING: MONDAY COULD BE A BLOODBATH Read this before it's too late. Two of the largest holders of U.S. debt are heading for the exit at the same time, and almost nobody understands what that unleashes. → Japan is offloading a massive wave of U.S. Treasuries → China just cut its holdings to $633 billion, the lowest since 2008 And the U.S. just confirmed how serious this is by doubling its bond buybacks to cover the damage. If you own any assets, you need to understand what's happening: the biggest carry trade in history is starting to unwind. For decades, Japan pinned rates near zero, making the yen the cheapest money on Earth. Investors borrowed trillions of it and poured that cash into Treasuries, stocks, real estate, and crypto worldwide. That trade became the plumbing underneath global asset prices. Now it's breaking. Japan is buried under soaring debt, an aging population, and a collapsing yen, so the money is being pulled home. And China is stacking pressure on top. It's been steadily dumping Treasuries and loading up on gold instead. Less demand for U.S. debt, more for hard assets. The message is clear. Here's why it matters: when the two biggest buyers step back at once, someone else has to absorb that supply, and they'll only do it at higher yields. That's exactly what's happening. The 30-year Treasury yield just pushed above 5.3%, the highest since 2007. The Treasury is now forced to buy back its own debt because demand is drying up. That's not strength. That's a desperate move. And it feeds on itself: higher yields make the debt more expensive to finance, which forces more issuance, which pushes yields even higher. Most people won't understand why markets are unraveling until it's already happening. I've studied these cycles for over 12 years and called nearly every major top and bottom. I'm warning you now. If you want to survive the 2026–2027 cycle, follow and turn on notifications. A lot of people are going to wish they'd listened sooner.
Shelpid.WI3M146,467 просмотров • 1 месяц назад

🚨 SPACEX IS REPEATING NVIDIA Put the two charts on top of each other and it's the same picture. NVIDIA's crash and recovery on top, SpaceX tracing it candle for candle underneath. $SPCX is already down nearly 50% from its highs. Most people see a failed IPO. I see the setup that turned NVIDIA into one of the best trades of the decade. NVIDIA did the same thing: crashed 65%+, media called it dead, retail panic-sold the $70 bottom, smart money accumulated. Then $70 → $110 → $150 → $206. Now look at SpaceX below it - same curve, same flush into the $70, same recovery to $300. That $70 zone is where everyone walks away in disgust. It's exactly where the best setups are born. My plan: Buy zone: $85–115 Target: $250+ But I'm not rushing. Unlocks are still ahead, the float's about to explode, and there's likely one more flush before the base is built. I want the exhaustion the moment the last seller gives up. Most people get interested only after a new ATH. By then the easy money's gone. The moment I buy $SPCX, I'll post it here first. Turn notifications on.
Shelpid.WI3M245,665 просмотров • 2 месяцев назад

🚨EVERYTHING IS GOING EXACTLY AS I SAID!!! It IPO'd, ripped, and everyone called it the buy of the decade. Now we're at $110 and the chart has already broken. And this was the easy part. Here's the full map, day by day: IPO → the top 10 days → $160 20 days → $140 NOW → $110 60 days → $90 80 days → $70 ← the bottom 100 days → $110 120 days → $200 140 days → $300 Down to $70 first. Then the reversal that makes people rich. Why the drop has to happen the math is brutal and public: → Only ~4% of shares actually trade. Nasdaq bent the float rule to let this listing through. → It got jammed into the indexes, so every passive fund was forced to buy near the top. → Insiders still hold 96% of the supply. → The first unlock hits August 6 at Q2 earnings ~20% of insider shares go free and the float doubles overnight. → Then it doubles again through the fall, all the way to full unlock. Sit with that. This entire collapse happened on a tiny float with almost no supply. The actual wall of stock hasn't even arrived yet. That's what takes us to $70. And look at the backdrop: Apple's printing new highs while SPCX bleeds to fresh lows. That's not a market problem - that's a SpaceX problem. Hype dead, capex enormous, valuation near 100x sales, unlock cliff dead ahead. But here's the part nobody's ready for: once that last unlock clears and the forced sellers are gone, the supply overhang disappears. That's when it reverses: $70 → $110 → $200 → $300. The bottom isn't where you panic. It's where you position. Everything I said would happen is happening. No surprises. Save this. Turn on notifications. Or come back in a few months wishing you had.
Shelpid.WI3M238,264 просмотров • 2 месяцев назад

🚨 WARNING: SOMETHING TERRIBLE JUST STARTED Japan just dumped $71 BILLION in U.S. Treasuries, its biggest sell-off in decades. And that's not even the scary part. Japan is still sitting on ¥15.3 TRILLION in bond losses. They've hit the panic button. Here's what's really happening. Japan is selling Treasuries to defend the yen and prevent a bigger crash. At the exact same time, its gold holdings just hit an all-time high. That's not a coincidence, they're dumping dollar assets and keeping the gold. And it's not just Japan. China is doing the exact same thing, selling Treasuries while stacking gold to fresh records. Two of the world's largest economies, moving in the same direction: → Selling U.S. Treasuries → Buying gold → Cutting dollar dependence This isn't an isolated sale anymore. It's a structural shift in how major economies manage their reserves. And it feeds on itself: More Treasury selling → More pressure on bonds → higher yields → More intervention → More gold buying → Less dollar dependence. Now here's why it matters right now. When U.S. markets reopen after the long weekend on September 7, they'll be pricing all of this at once, record Treasury selling, rising yields, and a weakening dollar backdrop, right as the S&P sits at record highs on thin September liquidity. That's a dangerous mix. Rising yields are poison for stretched valuations. And a market this concentrated has nothing underneath to catch it if the bond market starts cracking. This is how the global system changes. Not overnight. Gradually, then suddenly. I've studied these cycles for over 12 years and called nearly every major top and bottom. I'm warning you now. If you want to survive the 2026-2027 cycle, follow and turn on notifications. A lot of people are going to wish they'd started paying attention sooner.
Shelpid.WI3M124,217 просмотров • 1 месяц назад

🚨 I WARNED YOU. AGAIN. THIS IS NOT NORMAL. Right now: Silver: below $60 - first time since December Gold: wiped out its entire 2026 gain Platinum, Palladium: bleeding with them The assets people buy to feel safe are the ones crashing hardest. Silver alone is down ~21% in a month. This is what the start of a DELEVERAGING CYCLE looks like. The dollar is surging. Real yields are rising. Margin desks are forcing positions out. And as tech stocks crater this week, funds are dumping metals just to raise cash. When the safe havens fall with the risk assets, that's not a sell-off. That's the market grabbing for liquidity at any price. We already got the preview in January silver crashed 35% in a single day, one of the most violent unwinds in history. That setup never cleared. It's draining again now. I've spent 10+ years in these markets and called every major top and bottom along the way. When I make my next move, I'll post it here publicly, in real time. Turn notifications on. The ones who scrolled past this will understand why soon enough.
Shelpid.WI3M301,865 просмотров • 3 месяцев назад