Loading video...

Video Failed to Load

Go Home

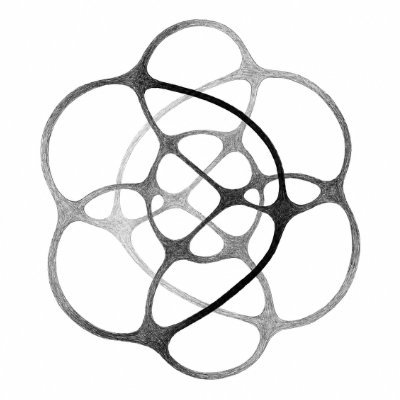
A bar magnet spinning at angular speed Ω is a magnetic dipole m turning in its own plane, and it radiates at f = Ω/2π. In that plane E points straight out of it, E ∝ m̈ × r̂ at the retarded time t − r/c, so each far...

23,468 views • 6 days ago •via X (Twitter)

0 Comments

No comments available

Comments from the original post will appear here

Related Videos

[Discrete Fourier Transform] by Hand ✍️ In signal processing, the Discrete Fourier Transform (DFT) is no doubt the most important method. But the math involved is extremely complex, literally, involving a summation over a complex number term e^(-iwt). I developed this exercise to demonstrate that underneath such complexity, DFT is just a series of matrix multiplications you can calculate by hand. ✍️ Once you see that, it should not surprise you that a deep neural network, which is also a series of matrix multiplications, with activation functions in-between, can learn to perform DFT to process and analyze signals so effectively. How does DFT work? [1] Given ↳ Signals A, B, and C in the 🟧 frequency domain: ◦ A = cos(w) + 2cos(2w) ◦ B = cos(w) + cos(3w) + cos(4w) ◦ C = -cos(2w) + cos(3w) ◦ Each signal is a weighed sum of four cosine waves at frequencies 1w, 2w, 3w, and 4w. ◦ We will apply Inverse DFT to convert the signals to time domain representations, and then demonstrate DFT can convert back to their original frequency domain representations. ↳ Signal X in the 🟩 time domain. X is sampled at 10 time points 1t, 2t, …, 10t: ◦ X = [-2.5, -1.8, 3, -0.7, -1.0, -0.7, 3, -1.8, -2.5, 5] ◦ Suppose X is also a weighted sum of the same four cosine waves, but we don’t already know their weights. We will apply DFT to discover them. [2] 🟧 Frequency Matrix (F) ↳ Write the coefficients of A, B, C as a matrix F. Each signal is a row. Each frequency is a column. ↳ A → [1, 2, 0, 0] ↳ B → [1, 0, 1, 1] ↳ C → [0, 1-, 1, 0] [3] Cosine → Discrete ↳ Sample from the continuous cosine waves at discrete time points 1t, 2t, 3t, to 10t. [4] Cosine Matrix (W) ↳ Write the samples as a matrix, Each frequency is a row. Each time point is a column. [5] Inverse DFT: 🟧 Frequency → 🟩 Time ↳ Multiply the frequency matrix F and the cosine matrix W. ↳ The meaning of this multiplication is to linearly combine the four cosine waves (rows in W) into time-domain signals (rows in T) using the weights specified in F. ↳ The result is matrix T, which are signals A, B, C converted to the time domain. Each signal is a row. Each time point is a column. [6] Transpose ↳ Transpose T, converting each signal’s time domain representation from a row to a column. [7] DFT: 🟩 Time → 🟧 Frequency ↳ Multiply the cosine matrix W with the transpose of matrix T. ↳ The purpose of this multiplication is to take a dot-product between each time-domain signal (columns in the transpose of T) and each cosine wave (rows in W), which has the effect of projecting the signal onto a cosine wave to determine how much they are correlated. Zero means not correlated at all. ↳ The result is an intermediate version of the “recovered” frequency matrix where each column corresponds to a signal and each row corresponds to a frequency. ↳ Compared to the original frequency matrix F, this intermediate matrix has non-zero weights in the correct places, but scaled up by a factor of 5 (n/2, n=10). For example, signal A, originally [1,2,0,0], is recovered at [5,10,0,0]. [8] Scale ↳ Multiply each value by 2/n = 1/5 to scale down the intermediate matrix to match the magnitude of the original frequency matrix F. [9] Transpose ↳ Transpose the recovered frequency matrix back to the same orientation of the original frequency matrix F. ↳ Like magic 🪄, the result is identical to the original F, which means DFT successfully recovered the frequency components of signals A, B, C. [10] Apply DFT to X: 🟩 Time → 🟧 Frequency ↳ Now that we have some confidence in DFT’s ability to recover frequency components, we apply DFT to X’s time-domain representation by multiplying W with X. ↳ The result is the an intermediate matrix. [11] Scale ↳ Similarly, we scale down by a factor of 5 to obtain the recovered frequency components of X (a column). [12] Transpose ↳ Similarly, we transpose the recovered column to row to match the orientation of the frequency matrix. ↳ Using the coefficients [0,0,3,2], we can write the equation of X as 3cos(3w) + 2cos(4w). Notes: I hope this by hand exercise helps you understand the essence of DFT. But there is more technical details, such as: • Sine: The complete DFT math also includes sine waves that follow a similar calculation process. • Phase: Here, we assume all the cosine waves are aligned at the origin, namely, phase is 0. If a phase p is added, for example, cos(w+p), we will need to calculate the sine component and use their ratio to figure out what p is. • Magnitude: If phase is not zero, the magnitude will need to be calculated by combining both cosine and sine terms.

Tom Yeh

116,622 views • 2 years ago

Contrail lesson! 1. “Chemtrails” don’t exist. Just to get that out of the way. 2. Observe the satellite loop and Skew-T chart. In the IR satellite loop you can see yesterday, the West Coast had a decent short wave ridge suppressing moisture over California and Nevada. Today, you can see moisture from a low pressure over the Pacific spilling over the ridge that is now moving east of California. This is upper level moisture ADVECTING into the area. This upper level moisture is mainly above the 500mb level, or 20,000ft. 3. Now observe the Skew-T chart. Particularly clue into the 300mb level. This is a perfect example of what I talk about all the time, and why it’s important to pay attention to the 300mb level. This moisture layer is advecting particularly at the 300mb level, and synoptic scale cirrus development, and advection, typically occurs at 300mb. This is key because aircraft are flying at and above the 300mb level. 4. So, lastly, observe the pictures that I took of the sky over northern Nevada at the time of this post. You can see the layer of cirrus as well as contrails persisting in that moisture layer, exactly as depicted in the satellite shot AND confirmed by the Skew-T chart. Keep in mind that temperatures at this level of the atmosphere are typically -20 to -50°C. In this case, you can see that the temperature at 300mb is -40°C and relative humidities at this level are far different than what you experience at the surface. Any decrease in the gap between temperature and dewpoint at this level can significantly increase the relative humidity. This is why it’s referred to as “relative”because it’s far different than temperatures and dew points at the surface. So, to bring it all together, aircraft flying at these altitudes, which most commercial and military aircraft do, injecting warm, moist air from the engines rapidly into the super cooled environment, not only instantly form contrails, but when relative humidities are as depicted in this example, will enable contrails to persist for hours at a time supported by the moisture existing in that layer. This is what causes persistent contrails. These ARE NOT “chemtrails” and because they persist, does not, and will not ever, make them “chemtrails.” Now that you all needed your government to tell you that climate change was a hoax and I’ve been telling you for years that the “Geoengineering” and “chemtrail” nonsense are propaganda directly related to the climate change hoax, hopefully you can take some time to learn the basics of the atmosphere and understand what I’m showing you here, and how it works, so you’re not fooled by climate propaganda going forward. Thank you for your attention to this matter. 💪🏼🇺🇸

Dylan Tucker

26,804 views • 11 months ago

There is a room in Málaga that was built to be the closest thing on earth to standing inside heaven. It is called the camarín of the Virgin of Victory, and it is hidden at the top of a tower inside the Santuario de la Victoria. To reach it, you climb and the ascent is the entire point... The building you are climbing through was completed in 1700, and it was designed as a single argument made in stone. At the bottom lies a crypt: a black chamber crowded with white plaster skeletons, a meditation on death and the brevity of life. From there a staircase rises, and as you climb it the light grows stronger and the imagery changes from bones to saints. The architects of the time understood this ascent as the soul's own journey, the dark crypt as the stage of penitence, the staircase as the stage of spiritual progress, and the room at the very top as the final stage: the union of the soul with the divine. That room at the top is the camarín, and its dome is one of the most extraordinary interiors in Spain... Every surface is covered in white and gold plasterwork. There is no empty space anywhere. The Baroque called this horror vacui, the horror of the void: the conviction that a space meant to represent heaven should not contain a single bare patch of stone. Out of that plasterwork emerge angels, flowers, birds, and mirrors. The mirrors are not decoration alone. They catch the light pouring in through the windows of the drum and throw it around the chamber, so that the gold seems to move and the whole room appears to shimmer and breathe. This wonder was built by people who believed that if you wanted to show a human being what heaven might feel like, you did not describe it to them. You built a room, and you let them climb into it... -- -- -- If you enjoyed this, I write a weekly newsletter read by over 50,000 people who love rediscovering the beauty of the past. You can join us here: If you'd like to support my work, a paid subscription is what makes it possible.

James Lucas

69,389 views • 4 months ago

Every bodybuilder on the internet tells you to eat a gram per pound of bodyweight. The research says you can stop at 0.7. For a 170 pound man that is 170 grams a day against 119. Fifty grams. Every day. Forever. A pooled analysis of forty-nine resistance training studies found that gains improved as protein went up, and then stopped improving at around 0.7 grams per pound. Past that point the line went flat. More protein in, no more muscle out. The error bar around that plateau stretched up to a gram per pound. The number in circulation is the top of that error bar, repeated for thirty years until it became the target. So the extra fifty grams does not build anything. Your liver strips the nitrogen off it and burns the rest, which is an expensive way to produce two hundred calories. Two hundred calories you could have taken as butter, which arrives with vitamin A, D, E and K2 already dissolved in it. At 119 grams you get there from food without trying. Three eggs, a ribeye, a lump of cheese, and you are past it before dinner. At 170 you are weighing chicken breast on a kitchen scale and drinking your supper. The men who set that number were building physiques on more than food, and the protein was never the part doing the work. There is also a ceiling, because your liver can only convert so much protein an hour. Trappers living on lean rabbit worked that out centuries before anyone measured it. So eat the meat, eat plenty of it, and then add the butter. That is the only thing on the plate with no ceiling on it, and the one part nobody has ever tried to sell you.

Sama Hoole

212,730 views • 1 month ago

the model in that clip has no good signal in it. it still put up +17% against the index's +5% the formula is doing the work R(t) = (Rmax / 7) · Σ s_i(t) seven separate signals, each scored, averaged into one number that's the entire model. no genius indicator anywhere in it and that's the part retail keeps missing retail hunts for the one signal that works a desk assumes every individual signal is weak and builds around that assumption here's why that assumption wins take N signals, each with sharpe s, and average them if they're uncorrelated, the combined sharpe is: s · √N seven weak signals at sharpe 0.3 each 0.3 × √7 = 0.79 nothing in that stack survives a backtest alone. together they clear the bar the noise in each signal is independent, so averaging cancels it the edge in each points the same way, so averaging keeps it that asymmetry is the whole mechanism but there's a catch, and it's the one that kills retail attempts correlation. the real formula is: s · √( N / (1 + (N−1)ρ) ) at ρ = 0.5 those same seven signals give: 0.3 × √(7 / 4) = 0.40 half the benefit, gone seven versions of momentum with different lookbacks aren't seven signals. they're one signal, repeated so the search isn't for better signals it's for signals that are wrong at different times grinold formalized this in 1989. the fundamental law of active management: IR = IC × √breadth skill per bet times the square root of how many independent bets you take you can be barely right, as long as you're barely right about many uncorrelated things renaissance doesn't run one model. it runs thousands of weak ones that's not a compromise. that's the design retail asks "is this signal good enough to trade" a desk asks "what does this add that i don't already have" the math is public. grinold's paper, every portfolio theory textbook the correlation matrix that tells you whether your signals are actually distinct is three lines of python they weren't finding better signals they were finding signals that disagree full breakdown in the article below

delost

28,032 views • 2 months ago

A single E. coli cell, placed on a dish, will become 70 billion cells in just 12 hours. That’s exponential growth. But a new preprint shows that it's possible to engineer E. coli to grow linearly instead, where only one daughter cell continues dividing and the other stops. First, some context. In nature, there is a bacterium called Mycobacterium smegmatis (initially discovered in 1884 in ulcers scraped from syphilis patients.) M. smegmatis is weird because it divides asymmetrically. These cells grow only from one end, and all their cell wall biosynthesis machinery is located on that one end. So when the cell divides, one daughter gets this machinery and the other gets nothing. The daughter that gets the machinery can keep dividing immediately, but the other daughter has to remake all that machinery from scratch, so its growth is delayed. E. coli doesn’t grow like this. When it divides, it pinches in the middle and splits everything evenly. Enzymes, metabolites, and proteins get partitioned more or less randomly between the two daughters. For the new preprint, though, researchers engineered E. coli to behave more like M. smegmatis. Here is how they did it: First, they deleted a gene called cyaA, which encodes an enzyme (adenylate cyclase) that makes a molecule called cAMP. cAMP is SUPER IMPORTANT! It is a nutrient sensor that instructs E. coli to switch on genes that help it digest non-glucose carbon sources when glucose is scarce. Without cAMP, E. coli cells growing on alternative carbon sources will starve; they won’t know how to eat the food. Next, they added back a “split” version of the cyaA gene into the cells. In other words, they split the gene in two so that each half of the enzyme is made separately. Cells can only make cAMP, and thus eat non-glucose carbon sources, if these two halves come together. To facilitate that “coming together,” the researchers also fused the split cyaA proteins to sticky proteins that clump together, and to a fluorescent protein (to make it easy to track these molecules in the cell.) So now some interesting things start to happen if you grow E. coli on a growth medium lacking glucose. As the cell grows, its cyaA “halves” start clumping together into a giant ball. Inside the aggregate, the two enzyme halves come together and make cAMP. And when the cell gets big enough and divides, the clump of cyaA RANDOMLY goes to either daughter cell #1 or #2. The daughter that gets the aggregate (called PA+ in this paper) can keep dividing. The daughter that doesn’t (PA–) cannot. It still grows a few times — about four divisions — because it inherits some leftover cAMP from its mother. But after that, the metabolite is diluted away, and the cell stops growing. PA+ cells went through about 23 divisions on average before their aggregate decayed. And the population of cells, as a whole, grew linearly. This paper is cool because there are many applications where exponential growth is too unpredictable and, perhaps, unsafe. If you want to engineer bacteria to deliver drugs, clean up waste, or live in the gut, you don’t want them to double uncontrollably. This paper shows you can make them expand in a controlled, linear way. Alas, mutations could break this whole engineered system. A mutation that restores cyaA, for example, would give cells a new way to make cAMP. Mutations that make the aggregates split between daughters would break the asymmetry, too. But still, I really enjoy proof-of-concept engineering papers like this.

Niko McCarty.

58,087 views • 1 year ago