Loading video...
Video Failed to Load
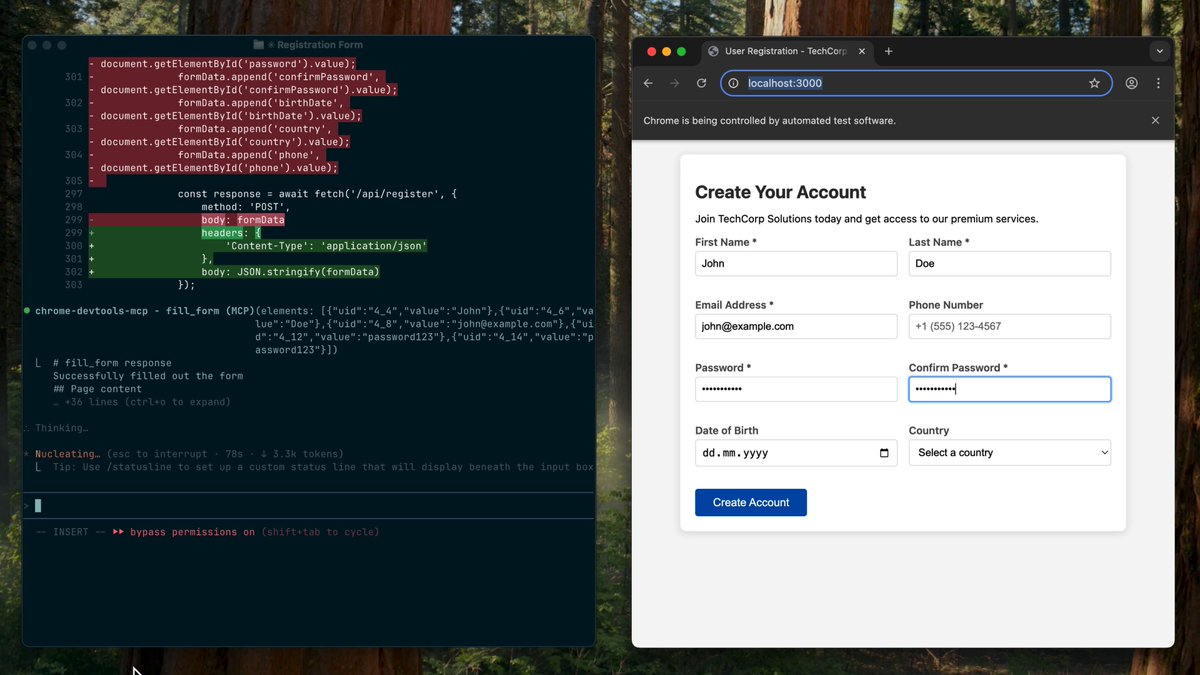
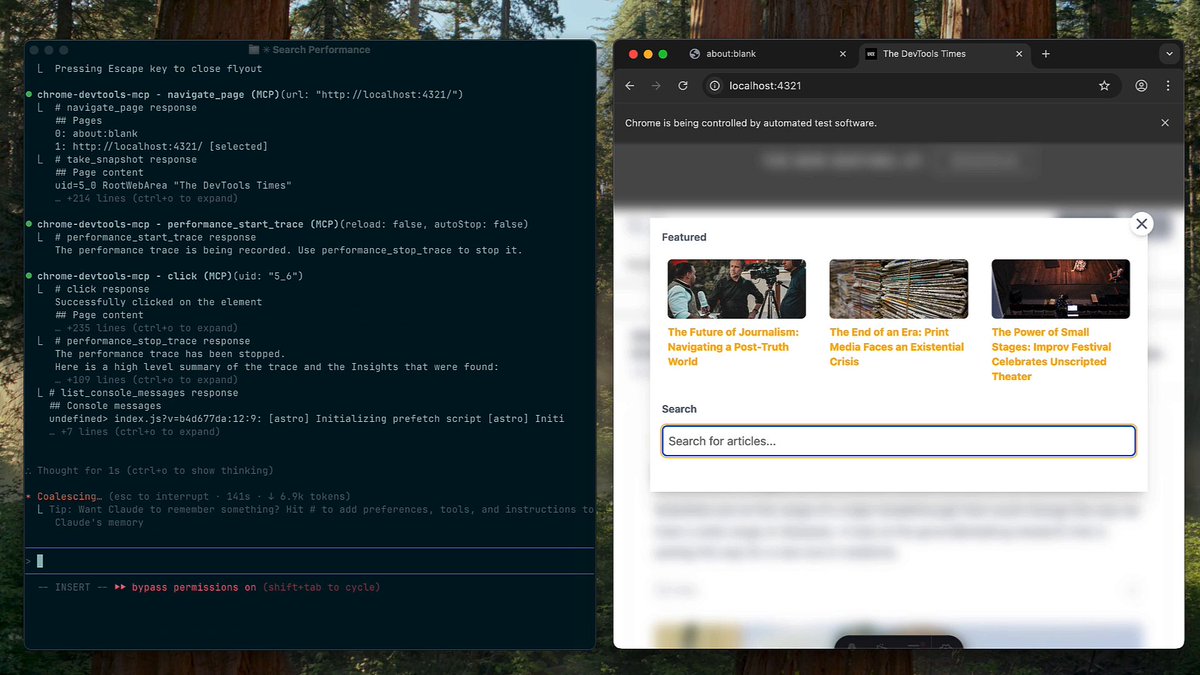
How to add Chrome DevTools MCP to Claude Code (Bookmark this post to follow the setup later) This lets Claude debug your web apps in a real browser... performance traces, network inspection, console errors. Requirements: - Node.js 22+ - Chrome browser In the video below I show you: -... show more

52,510 views • 1 year ago •via X (Twitter)
15 Comments

Installation command: npx claude-code-templates@latest --mcp=devtools/chrome-devtools --yes Example prompt I use in the video: "Run a performance trace on and suggest ways to make it load faster" Claude Code detects the MCP, launches Chrome in debug mode, and analyzes the page automatically. Other useful prompts: - "Why are images not loading on localhost:8080?" - "Check what's wrong with the layout on this page" - "Verify my fix works in the browser" More details:

This is gold. Debugging with Claude in a real browser? Game changer for web devs.

Ive been loving Chrome Devtools mcp. Of course it eats up tokens like pacman, but it’s a huge timesaver.

Integrating real browser tools definitely takes debugging to another level. Excited to see how this shifts development workflows!

Huge unlock. Claude + real DevTools is the dream duo. Does it capture CPU profiles too?

Debugging web apps: where performance traces meet existential crisis 🔍

a whole new security nightmare

what video recording software is this ?

just curious, what do you use it for?

Wow, integrating Chrome DevTools with Claude sounds like a total time-saver. That JSON setup and terminal view look pretty slick-definitely a step up from traditional debugging.

Do you want to try MCP More? The built-in MCP marketplace allows you to install various MCPs with one click, including the Chrome DevTools MCP.

Can this work with custom agents that do not have knowledge about the code base

Love it! Performance traces + network inspection made easy

what apps did you use to record this ?

sounds like a game changer for debugging