正在加载视频...
视频加载失败
Introducing Cloudflare Traces Today we're launching Cloudflare Traces, a way for you to get an unprecedented view into requests going through Cloudflare! Why was a request blocked? Why did a request fail? Why was a request slow? Find out with Traces!

16 条评论

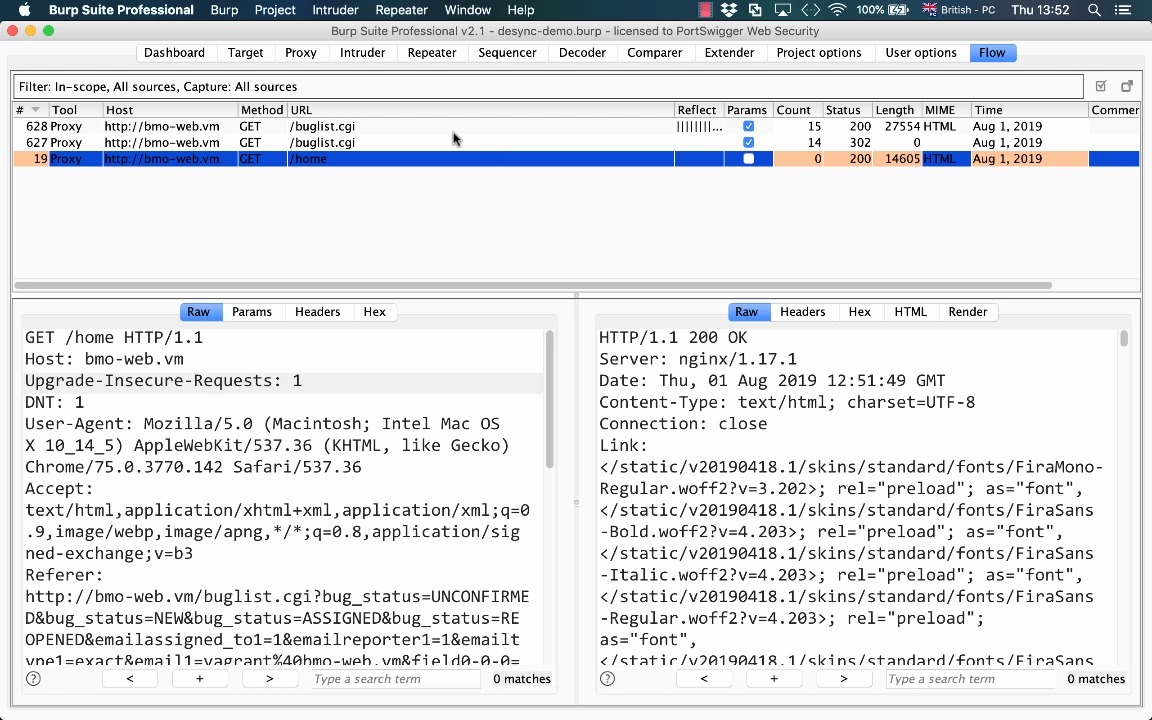
I've been helping customers debug issues for years now and our internal tracing at Cloudflare has always been the best tool for the job. Logs & analytics give a partial story. Understanding _exactly_ what, how and when something happened in a request is vital information Tracing gives you that. This will let you view exactly what happened in Cloudflare, what rules ran, what was matched, what was changed, what Worker we routed to, did we go to cache, did we go to an upper tier, did we move colos with Argo Smart Routing, etc. I am sooo fricking excited for this!! Please try it out, let me know any issues or feedback you have! Also worth noting, this is just the beginning - we have a LOT more to do on Traces - more spans, more info, more services, etc. Traces is free until December 1st so try it out!

@dillon_mulroy can i use this with Effect spans? please say yes

@threepointone cloudflare seems cool

it totally makes sense! (as an ex-cloudflare)

@eastdakota What. This is amazing omg

ya love to see it

Let’s gooo

my wife will not be happy about me spending another weekend reading cloudflare blog posts

Huge!

Pinning down why something got blocked used to mean cross-checking firewall events against WAF rules one at a time.

Can we respond to something right from a trac? Ie we see that this traffic was blocked by rule a, so we create an exception in one or two clicks?

“The request went somewhere” was a compelling mystery. Appreciate the new documentary evidence.

do we show cold start time ?

Useful for agents

@eastdakota Oh my god I can finally decode incoming trace context with workers?!

started doing this with K2 lmao