Video wird geladen...

Video konnte nicht geladen werden

Zur Startseite

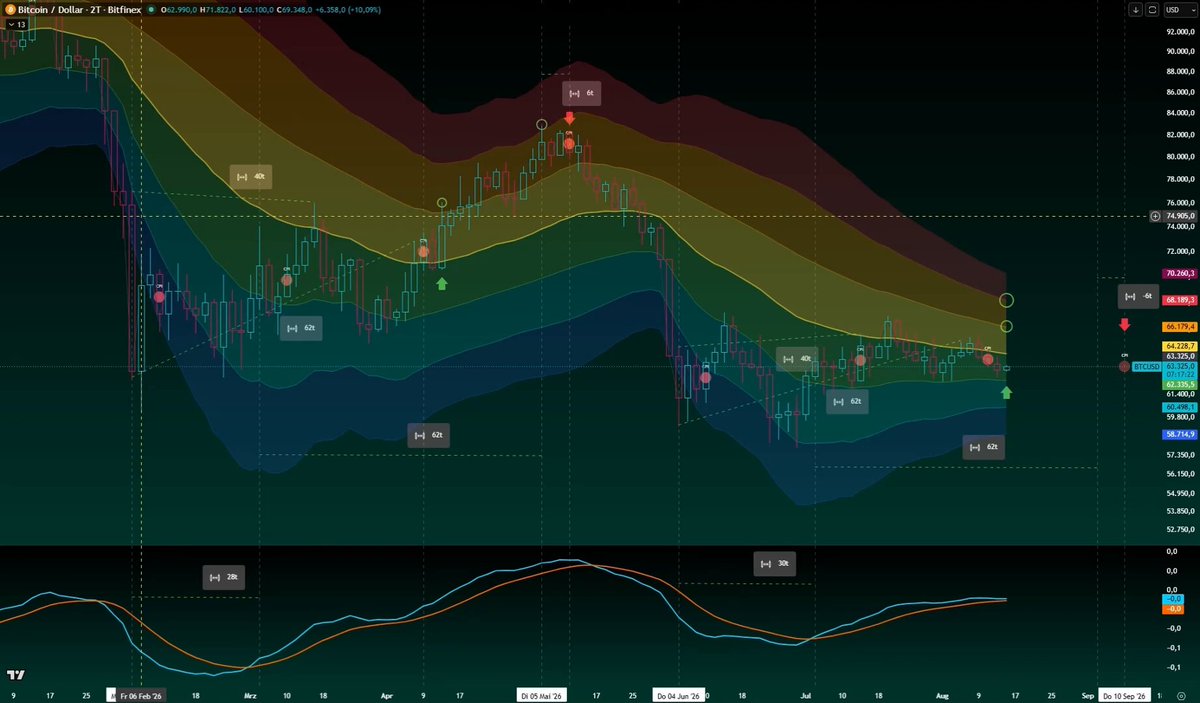
Measured from the wicks outside the blue box, the time axis has repeated 1:1. Back in 2023 the dump came within 2–3 days and landed exactly into Sunday, exactly like today. If the pattern continues this precisely, the last dump can rather be expected into Monday. A move toward...

57,206 Aufrufe • vor 17 Tagen •via X (Twitter)

31 Kommentare

Profilbild von XAPA
XAPAvor 16 Tagen

" If the pattern repeats this way, $87,000 looks next to me, followed by a drop into October. This thesis would only be confirmed if there is no rejection in the $83,000 range. "

Profilbild von At the Bitcoin Frontier 🦅
At the Bitcoin Frontier 🦅vor 16 Tagen

TEM is showing us the way. Great analysis, my friend. Enjoy your Sunday, pal!

Profilbild von XAPA
XAPAvor 16 Tagen

I just needed to send the sunday report, i will enjoy ;-) have a great sunday brother

Profilbild von At the Bitcoin Frontier 🦅
At the Bitcoin Frontier 🦅vor 16 Tagen

Awesome! Was already super excited for your Sunday Report, this week a #sidewayssunday

Profilbild von Aaron
Aaronvor 16 Tagen

Good Work sir

Profilbild von Tommy
Tommyvor 16 Tagen

Pump it

Profilbild von Krypto
Kryptovor 16 Tagen

Danke Boss!!! Warte auf den Wick, dann all in !

Profilbild von luffy
luffyvor 16 Tagen

Stark man hoffe geht so auf

Profilbild von Jenifer Ali
Jenifer Alivor 16 Tagen

Thanks Xapa🤍, much appreciated!! May you be blessed abundantly!!

Profilbild von abul6ix
abul6ixvor 16 Tagen

Thanks alot big bro.

Profilbild von Matteo
Matteovor 16 Tagen

Xapa predictions always on point!🎯

Profilbild von Pro Pro
Pro Provor 16 Tagen

Thanks man 💪

Profilbild von Asim Kabaha
Asim Kabahavor 16 Tagen

Der lang erwartete Dump

Profilbild von Musti
Mustivor 16 Tagen

💪🏼💪🏼💪🏼💪🏼💪🏼

Profilbild von zonko
zonkovor 16 Tagen

Thank you believe :)

Profilbild von wangeli
wangelivor 16 Tagen

🔥🔥🔥 lets gooo ✈️

Profilbild von Itzrenez
Itzrenezvor 16 Tagen

🔥🔥

Profilbild von Crimetek
Crimetekvor 16 Tagen

Thanks buddy for the Update. 🤝🔥🚀🚀

Profilbild von abo
abovor 16 Tagen

Pure Qualität

Profilbild von schlenzer05
schlenzer05vor 16 Tagen

🙌🏼🙌🏼🙌🏼

Profilbild von Nothing123
Nothing123vor 16 Tagen

Great analysis just waiting for my limit order to execute hehe

Profilbild von Trinity
Trinityvor 16 Tagen

Nice

Profilbild von Chev Chelios
Chev Cheliosvor 16 Tagen

Again.. cant thank you enough for your work .. u the goat

Profilbild von LeFrog James
LeFrog Jamesvor 16 Tagen

I don’t even want to imagine how much time you put into these analyses. That’s some seriously well‑executed work.

Profilbild von XAPA
XAPAvor 16 Tagen

Thank you for supporting me since sub 700 follower, James. 👋

Profilbild von iamreal
iamrealvor 16 Tagen

Sehr interessant bin gespannt !

Profilbild von sunita
sunitavor 16 Tagen

Thanks for update bro

Profilbild von ZeitundDaten
ZeitundDatenvor 16 Tagen

Danke Rohat.

Profilbild von Steeez
Steeezvor 16 Tagen

Great Job for Updating us. U are the king

Profilbild von /|/|1ko
/|/|1kovor 16 Tagen

😍😍

Profilbild von N369
N369vor 16 Tagen

Thanks for your work Xapa🐐

Ähnliche Videos

Let’s briefly look back at what actually happened back then, before the breakout was visible, as in the August thread. In 2023, the final bottom formed 147 to 161 days after the wick outside the blue TEM zone. The 161 days are explained by COVID, the FTX crash, and a two-week delay with a price difference of less than 1%. What matters is the time interval itself. It took 245 days to reach the top. The move from the wick outside the blue TEM zone to the top was +43.5%. From the last low, Bitcoin pumped for three weeks, then moved sideways for three weeks, and after that consolidation gained more than +24% within one week. The impulse ended after exactly three weeks with the first sign of weakness and a pullback of -11%. The highest high formed in week six. After that, price dropped -22%. From the end of the three-week sideways phase to the peak, it took 42 days. In 2026, the final bottom formed 147 days after the wick outside the blue TEM zone. It took 231 days to reach the top, without the two-week delay from back then. The move from the wick outside the blue TEM zone to the top is +45.5%. Here as well, Bitcoin pumped for three weeks from the last low, then moved sideways for three weeks, and after that consolidation gained more than +24% within one week. After exactly three weeks came the first sign of weakness and a pullback of -9%. The highest high formed again in week six and therefore lines up with the current week. From the end of the three-week sideways phase to the peak, it again took 42 days. A final upside impulse is possible and cannot be ruled out. If the structure repeats 1:1, the local top is already in. The key levels are the 50-week EMA/SMA . If Bitcoin finds support there, the path toward $100,000 remains open! If the pattern repeats 1:1, Bitcoin would likely sit around $78–79k next week, then pump into $82/83k. What matters is whether this range holds. The pattern is too precise to dismiss as coincidence. bitcoin:native

XAPA

56,839 Aufrufe • vor 3 Tagen