Загрузка видео...
Не удалось загрузить видео
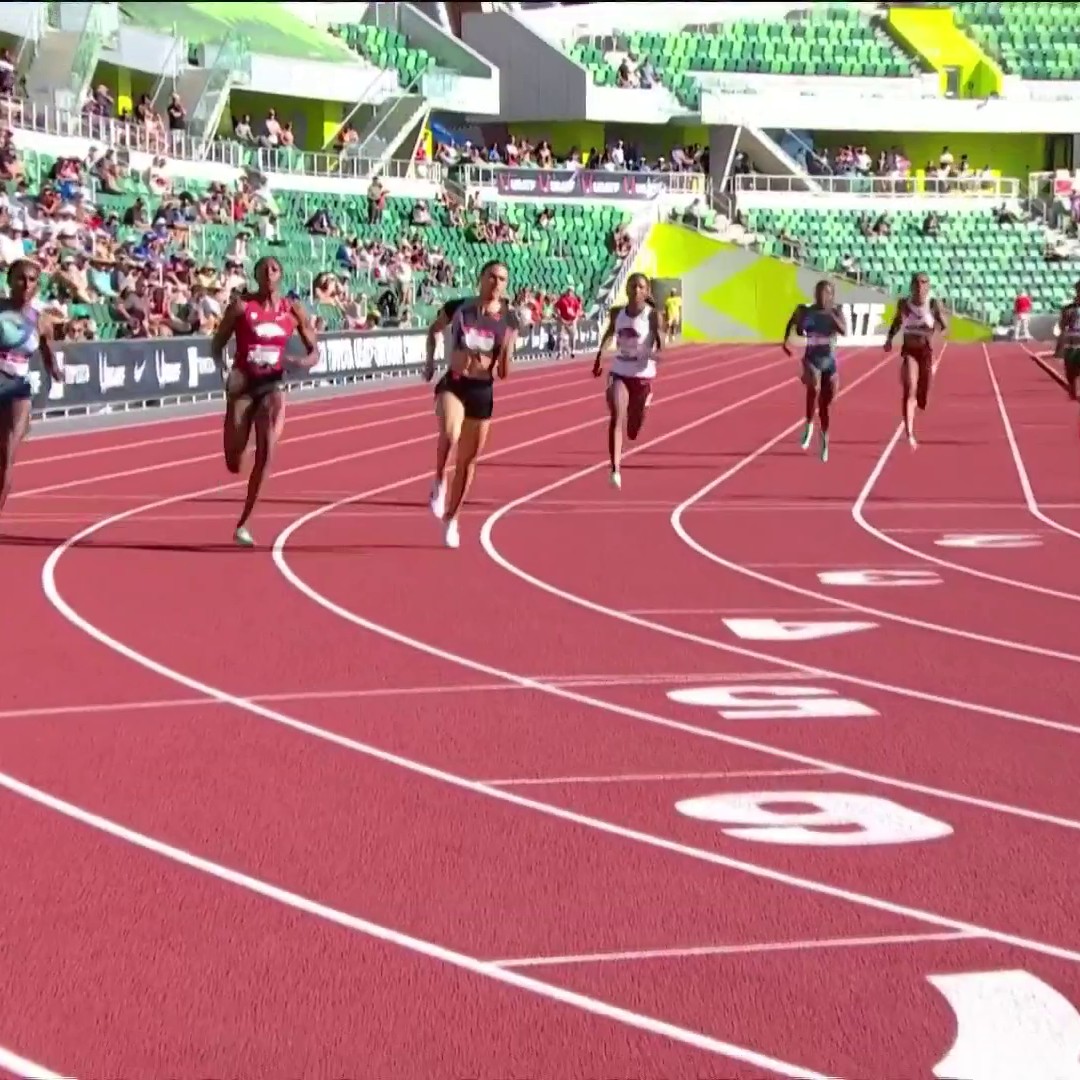
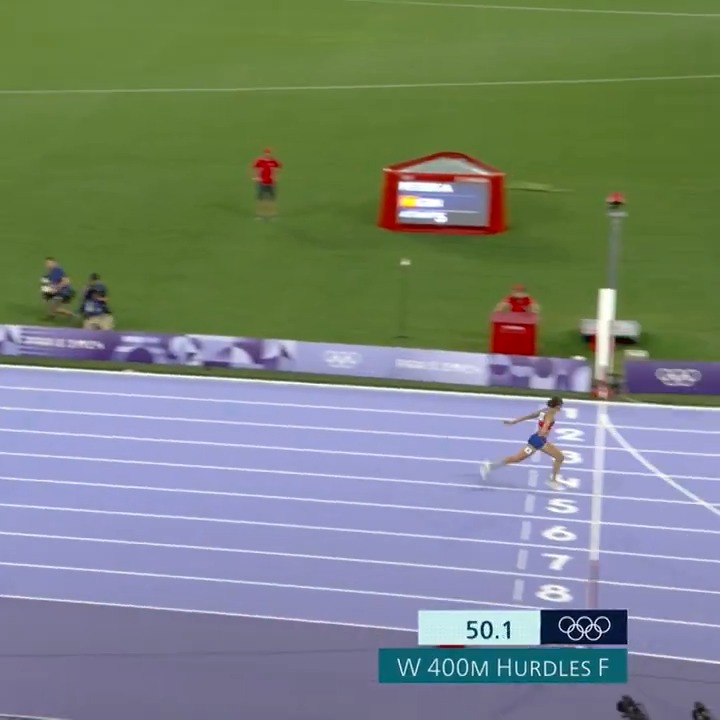
Race visualization showing how impressive Sydney McLaughlin-Levrone's world record was #ParisOlympics

471,152 просмотров • 1 год назад •via X (Twitter)
Комментарии: 10

Whooaaaaaa the 200 to 300 was craazzyyyyy.. that's some serious acceleration!

Syd ran a fast 100 and got close to Bol so Bol decided to run the next 100 super fast and she hit the wall at 250.

I know the 100m race is a straight line, but I would want to see a short distance race using the bend, I think this is where elite runners set themselves apart

Showing the MPH for each runner would highlight her lack of deceleration compared to the others, and make for a much better visual. Races are usually about who decelerates the least or the slowest.

1.5 seconds faster than the next closest competitor. Just insane talent and speed. 🐐

or u could just watch the race

Her engine is insane…. An ATHLETE

Be cool to have shown each hurdle split, each 100m split

Damnnnn @GoSydGo the goat

How’d she get such a shitty lane?