Video yükleniyor...
Video Yüklenemedi
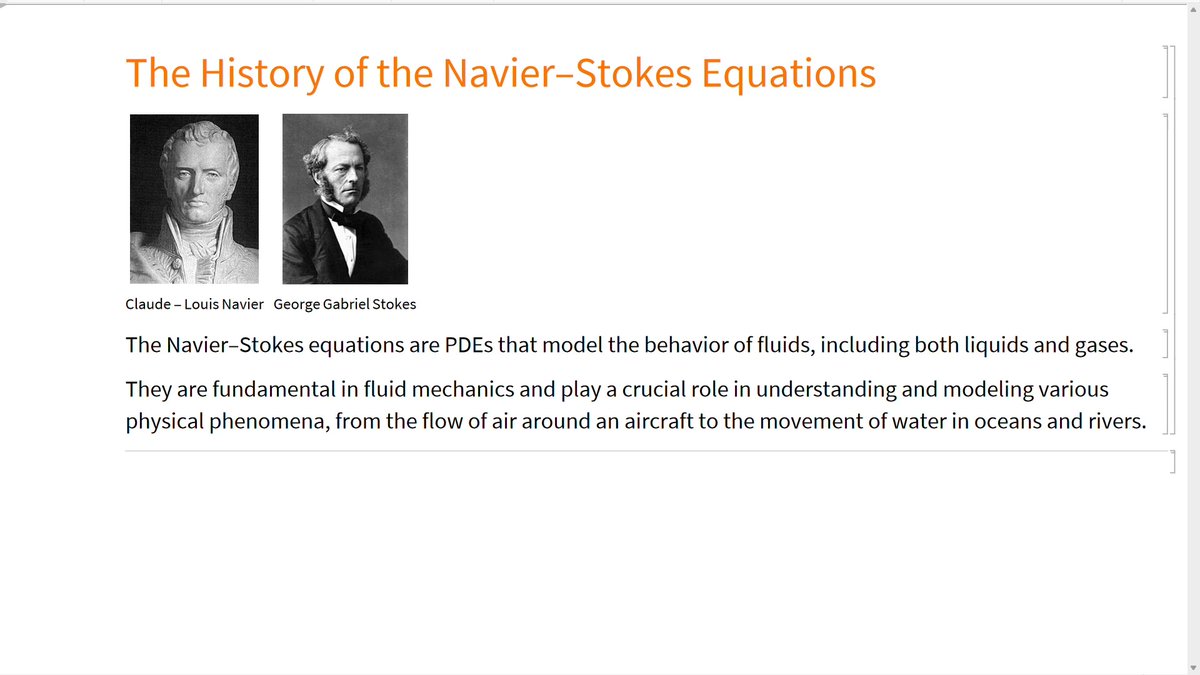
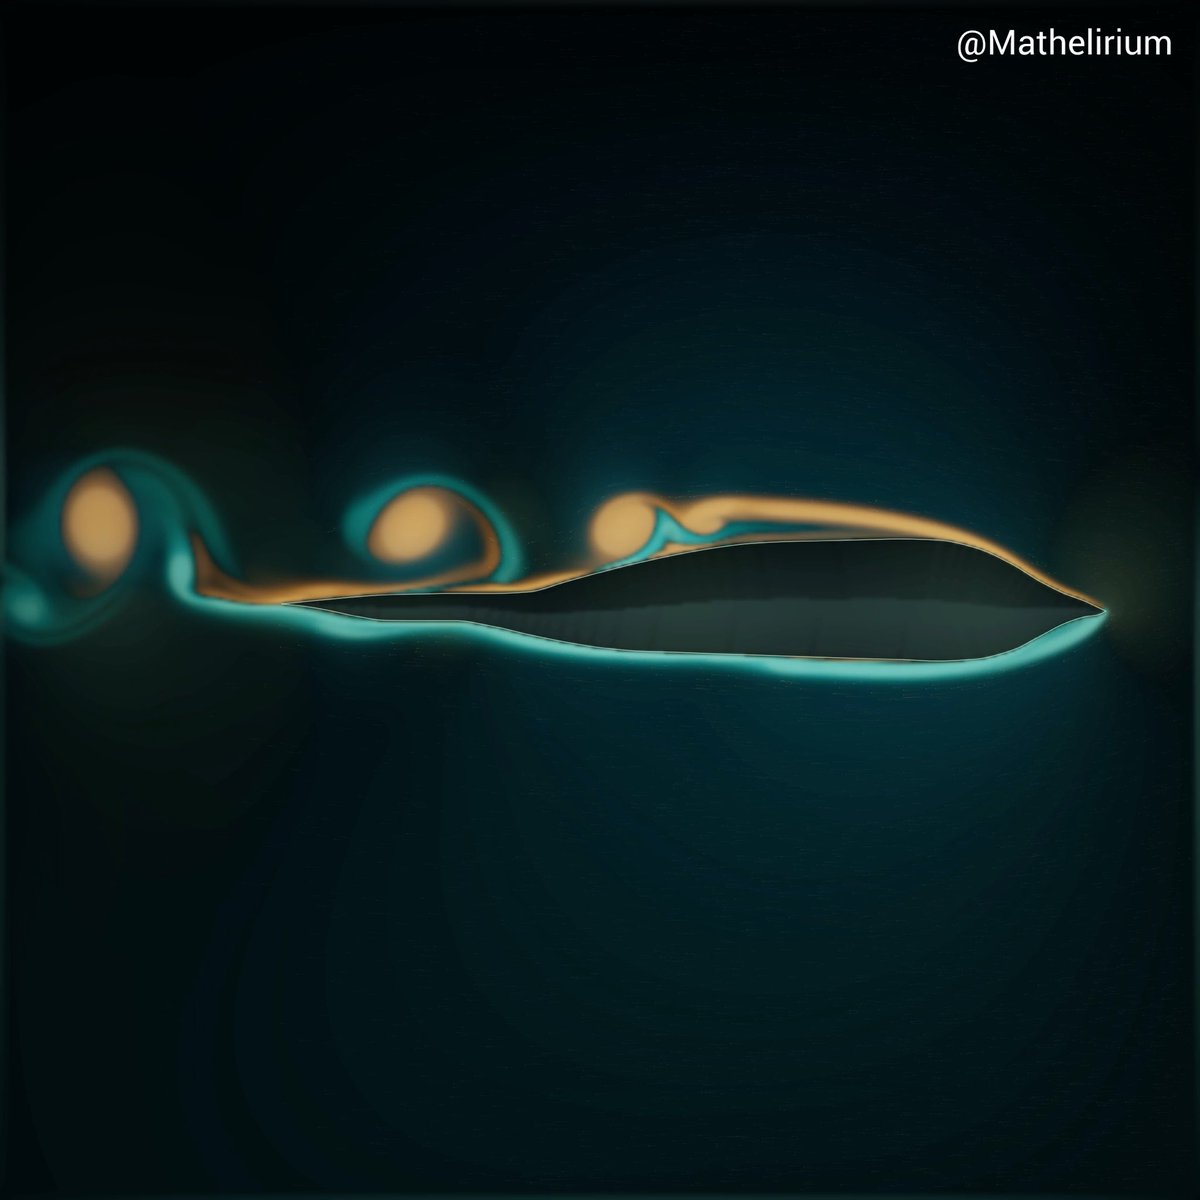
Visualizing fluid mechanics equations turns theory into: velocity fields, current lines and pressure maps reveal how fluids flow and mix. From Navier-Stokes to continuity, dynamic graphics make, viscosity and conservation visible, facilitating learning and engineering design."

33,070 görüntüleme • 9 ay önce •via X (Twitter)
9 Yorum

this is so underrated once you see navier stokes as colors and arrows, it stops being scary symbols same thing happened when i saw my first cfd sim - suddenly all the math felt like a real-world control panel

You are over complicating things and your math doesn’t support your claim.

Excellent post. Finally, something on Xwitter that appeals to Renaissance Men and not just Doinks' retard frog army. And now you know why the bulbous bows of ships are shaped like rabbits. Keep up the good work, Gentlemen!

@Na_thanks

I can't imagine a better music than Led Zeppelin for this video. Now, a little challenge: Can you do the same with a golf ball?

The effect is so obvious

Love it! Spin the cylinder muah hah hah!

Some flowmeters use this principle and drop in pressure to determine the flow rate. As the flow rate is proportional to the square root of pressure drop.

.