
Leni
@lenion • 31,137 subscribers
Ex. barber. Now a full-time trader. Turning knowledge into wealth. Discipline is key. NFA
Videos

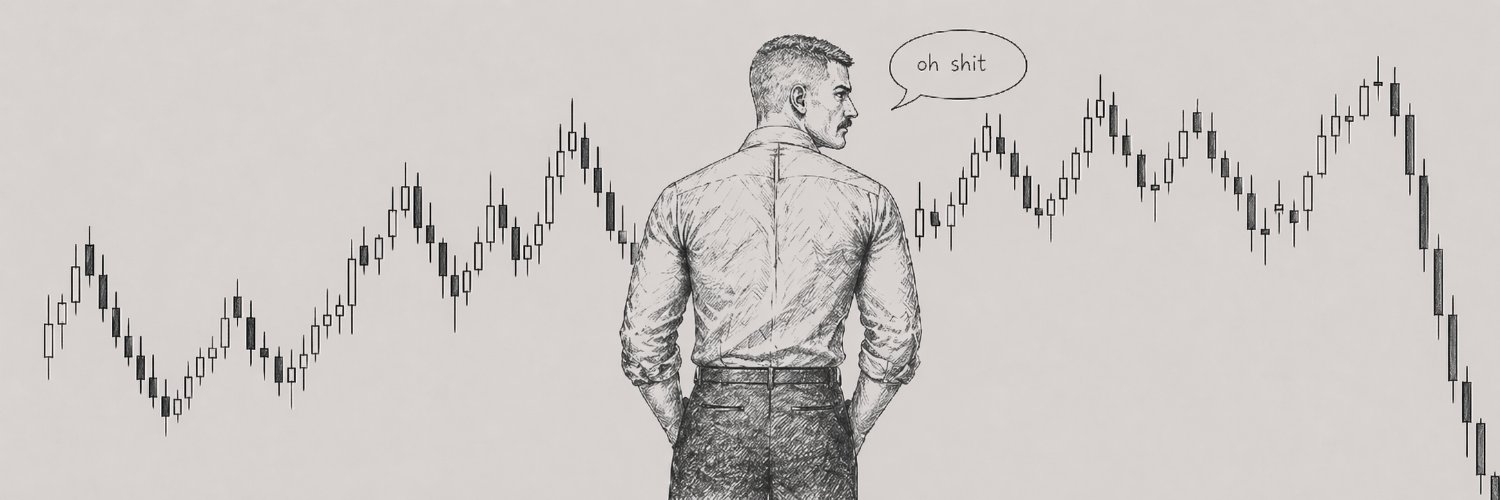
Something strange is happening Since 2013, Bitcoin has traded within an ascending channel But it may be on the verge of breaking below it The monthly $BTC chart doesn't look very good right now Most people will only notice the setup after the move starts Bookmark this. The next phase is gonna be very important
Leni166,754 views • 6 days ago

🚨 THIS IS HOW AI BUBBLE WILL CRASH S&P 500 Read the post carefully before buying stocks 3 AI and space giants are going public in the same year with a combined valuation approaching $4 trillion: 1. The biggest IPO wave in decades - SpaceX could become the largest IPO in history, raising up to $75 billion( $SPCX will debut on Nasdaq on June 12) - OpenAI has already filed a confidential S-1 and is targeting a valuation above $1 trillion - Anthropic is also considering a public listing at a valuation of around $1 trillion 2. The S&P 500 is currently being carried mostly by the Mag 7 and AI-related stocks (Nvidia, Microsoft, Google, Amazon, etc.), which make up roughly 33-35% of the index These 3 IPO could create a massive liquidity drain as investors move $75-200+ billion into SpaceX, OpenAI, and Anthropic shares Funds and investors would likely sell existing positions in today's market leaders to free up capital, with Nvidia, Microsoft, and Google among the first likely to feel the pressure On top of that, the S&P 500 has so far resisted fast-tracking these unprofitable giants into the index, meaning the capital rotation effect could put even more pressure on existing index components 3. History shows a concerning pattern At the peak of every major market bubble, capital became concentrated in a small group of "can't lose" companies: - The Roaring Twenties - The Nifty Fifty era - Japan's 1980s asset bubble - The Dot-Com Bubble of 1999-2000 Today, capital concentration in the tech sector is once again near historical extremes 4. After an IPO, early investors get the opportunity to lock in profits Historically, lock-up expirations have often increased selling pressure on newly public stocks During the Dot-Com era, even some of the highest-quality companies suffered massive drawdowns: - Amazon: -95% - Microsoft: -65% - Intel: -80% - Oracle: -80% - Yahoo: -97% A great business doesn't protect investors from overvaluation IPOs at these kinds of valuations, while many AI companies are still deeply unprofitable, are often a sign of market euphoria I've said this before, and the cycle is still playing out exactly according to plan Turn on notifications and drop your thoughts below The next phase is gonna be very important
Leni534,315 views • 20 days ago

🚨 S&P 500 MORE DANGEROUS RIGHT NOW THAN IT LOOKS The illusion of safety is what can make you poor I keep seeing people say, "It probably won't crash, it always goes up" That's exactly what concerns me When you buy an individual stock, you got that you can lose money But with the S&P 500, it's different, most people don't even consider the possibility of a crash anymore Just look at the dot-com bubble - back then, everyone thought everything was fine and the index would keep climbing for years But the final stage of every bubble begins when prices become absurd and fear disappears And prices right now really are getting absurd. The index is printing new highs almost every day with barely any meaningful pullbacks I'm not saying a crash is coming Monday, for example, but I am warning you that markets become the most vulnerable when the majority stops seeing any risk Right now I'm watching investor confidence closely, and the level of euphoria is extreme. That's usually the final stage Are you ready for what could happen next? Turn on notifications and drop your thoughts below The next phase is gonna be very important
Leni481,459 views • 24 days ago

🚨 GOLD IS REPEATING THE SCENARIO OF THE 2013 CRASH I've seen this before and I don't like how it ends Back then, people also believed that after years of gains, it was just a correction Since the beginning of 2026, gold has already fallen about 24% from its all-time high of $5,600 per ounce And March turned out to be the worst month since June 2013 - the exact moment when the most painful phase of the previous bear market began The scenario is repeating: Rally → ATH → Hawkish Fed → ETF outflows → Loss of momentum → Deep correction So far, almost everything lines up: 1. After the ATH, profit-taking accelerated Just like in 2011, gold rallied for years on fear, inflation, and crisis expectations But after peaking, the market started losing momentum 2. The Fed is once again the main source of pressure In 2013, investors feared tapering and rising real yields Today looks similar: the Fed remains hawkish, inflation is still elevated, the dollar is strengthening, and real yields are rising Historically, that's one of the worst environments for gold 3. Safe-haven demand is fading Tensions around Iran have eased Some capital is already rotating out of safe-haven assets and back into risk 4. ETFs are starting to reverse March saw strong outflows from gold ETFs Historically, major ETF outflows often appear when the market regime starts changing Yes, central banks are still buying gold But even record purchases by central banks can only soften the downside if the macro environment continues to deteriorate for gold If the Fed stays hawkish and the U.S. economy remains strong, the $4,100-4,200 zone may end up being just a temporary stop The main idea is simple: The market has already gone through the euphoria phase And if the 2011-2013 analogy continues to hold, the current decline may not be the end of the correction I've said this before, and everything is still playing out exactly according to plan Turn on notifications. If you're not following me yet, you might realize later that it was a mistake because I warned you Bookmark this. The next phase is gonna be very important
Leni146,058 views • 12 days ago

🚨 WARNING: THE SPACEX IPO IS THE BIGGEST TRAP OF 2026 Read this post carefully before buying SpaceX shares In 4 days, $SPCX will debut on Nasdaq The biggest IPO in history, with a valuation of around $1.8 trillion You may have noticed that demand has already exceeded $150 billion, while the public float is only 4-5% And I wouldn't rule out the possibility that the stock could easily jump 20-50% in the first days or weeks purely because of FOMO and the limited share supply But after that, the picture could change dramatically! 1. SpaceX didn't use the standard 180-day lock-up Instead, the S-1 includes a phased unlock schedule Insiders, employees, and early investors will be able to sell shares in stages starting in August: - August 21 (70 days) - +7% - September 10 (90 days) - +7% - September 25 (105 days) - +7% - October 10 (120 days) - +7% - October 25 (135 days) - +7% 2. On top of that, they removed the profitability requirement and are adding SpaceX to major indexes just 5 days after the IPO, while the usual waiting period is 90 days That forces 401(k) pension funds and passive index funds to buy SpaceX shares at inflated IPO prices and keep holding them throughout any decline 3. On top of that, there are major share releases after the Q2 earnings report (August) and Q3 earnings report (November) If the stock is trading 30% above the IPO price after Q2, a performance bonus will kick in and another +10% will be unlocked This staggered selling structure reduces the chance of one massive crash, but it creates several waves of selling pressure between August and November For comparison: when Meta went public in 2012 (one of the top 3 largest IPO in U.S. history, with a $104 billion valuation) The stock fell more than 60% within a few months after the IPO due to lock-up expirations and market concerns about its ability to monetize its business And there's one very important thing you need to remember! 4. The company is still unprofitable, posting roughly a $4.9 billion net loss in 2025 Passive funds (Nasdaq-100) will become forced buyers, but at the first sign of bad news they'll become forced sellers That's why I'm warning you not to become exit liquidity for insiders and VCs who have already made huge money from private funding rounds In the short term, the IPO looks very attractive for traders who know how to speculate But if you're planning to hold, you need to clearly understand this: August through November could bring serious volatility and a major correction I've said this before, and the cycle is still playing out exactly according to plan Turn on notifications and drop your thoughts below The next phase is gonna be very important
Leni200,873 views • 22 days ago

🚨 This scenario has repeated itself for 3 cycles in a row It shows up BEFORE EVERY major manipulation That's why I'm still bearish on Bitcoin You need to remember that there are 3 phases: - Distribution - Manipulation - Accumulation Right now we're in the MANIPULATION phase Distribution is already over But accumulation hasn't even started yet And I don't understand why most people don't see it - it's the same thing every cycle, just look at the chart, study Wyckoff, and it'll all make sense 2018 → 2022 → 2026 I also don't get the people waiting for $30k, think about it yourself - is it possible? Absolutely But what are the chances it actually happens? Pretty low This is exactly how smart money shakes out the last weak hands and turns you into exit liquidity So sure, you can buy here, but only through DCA, don't assume the bottom is in, you should have buy targets set for every major dip I've said this before, and the cycle is still playing out exactly according to plan In 2-3 weeks we'll see who's actually right Turn on notifications and drop your thoughts below The next phase is gonna be very important
Leni204,917 views • 23 days ago

Nobody is ready for a scenario like this But if Wyckoff were alive today, he'd be accumulating $BTC here That could happen under certain conditions: - The FED stops raising interest rates - No new wars or geopolitical conflicts - No major negative political news - Strong institutional and corporate demand - On-chain accumulation by whales and long-term holders - Favorable cycle positioning - Market cleansing and capitulation - Declining exchange reserves Only under these conditions would accumulation at this stage become possible Most people will only notice the setup after the move starts Bookmark this. The next phase is gonna be very important
Leni85,852 views • 11 days ago

🚨SILVER IS REPEATING THE 2011-2013 CRASH SCENARIO I've seen this before, and I don't like how it ends Since January 2026, silver has dropped around 48% from its all-time high of $121.6/oz, making January and February some of the worst months since 2011 The scenario is repeating almost perfectly: Rally → ATH → Hawkish Fed → ETF outflows → Loss of momentum → Deep Correction 1. After the ATH, profit-taking accelerated Just like in 2011, silver rallied for years on inflation fears, geopolitical tensions, and expectations of a structural supply deficit But after the peak, the momentum started to fade 2. The Fed is once again the main source of pressure Kevin Warsh's hawkish stance and expectations of tighter monetary policy are strengthening the dollar and pushing real yields higher - a bearish scenario for silver With money rotating from commodities into equities as the U.S. economy stays resilient, silver tends to underperform gold 3. Safe-haven demand is fading If tensions around Iran, the Middle East, or other geopolitical conflicts continue to ease, the safe-haven premium will keep shrinking Money will start flowing back into risk assets again 4. ETF outflows and speculative positions are unwinding During the 2026 correction, silver ETF saw noticeable outflows as investors reduced exposure and risk appetite faded Historically a sign of changing market sentiment 5. Margin requirements and leverage Back in 2011, CME margin hikes were one of the main catalysts behind the crash Today's market once again looks dominated by speculation after a parabolic rally 6. Fundamentally, silver is stronger than in 2011 due to a structural supply deficit and rising industrial demand However, the speculative and investment side of the market is behaving almost the same way it did in 2011 And unlike gold, silver doesn't benefit much from central bank buying, since central banks mainly accumulate gold, not silver If the 2011-2013 analogy keeps playing out: The current decline may not be the end of the correction A move down to the $50-55 range is possible, and in a more bearish scenario, silver could even fall toward $40+ over the next 6-18 months before industrial demand and supply deficits take control again I've said this before, and everything is still playing out exactly according to plan Turn on notifications. If you're not following me yet, you might realize later that it was a mistake because I warned you Bookmark this. The next phase is gonna be very important
Leni56,078 views • 8 days ago

🚨 SOMETHING BIG IS COMING Every Bitcoin bear cycle has left just 3 red candles on the 3-month chart 2018 → 3 red candles → bottom 2022 → 3 red candles → bottom 2025-2026 → 3 red candles (we're currently inside the 3rd one) Every cycle, most say this time is different and history won't repeat But that's how markets work The market is following the same rules once again And right now, we're sitting inside that 3rd red candle Do you realize what that means? We might be closer to the bottom than most people think Markets still follow the old rules I see a lot of people calling for a $30k bottom, but that feels almost impossible - the drop would be way too large Every cycle, the overall correction has become smaller and smaller That's why I don't think the bottom will be anywhere near $30k On top of that, there are barely any positive headlines right now, and this long bear market phase may finally be approaching its end The bottom will be found when most people are too scared to buy And years from now, everyone will call that moment obvious Even though it never was at the time I've said this before, and everything is still playing out exactly according to plan Turn on notifications. If you're not following me yet, you might realize later that it was a mistake because I warned you Bookmark this. The next phase is gonna be very important
Leni61,344 views • 10 days ago

🚨 What's happening right now already happened in 2022 The same MANIPULATION is forming again for Bitcoin History suggests a much bigger move is coming 2022: Top 1 → Сorrection → Top 2 → 120-day range with a bull trap → dump → Manipulation → Accumulation 2026: Top 1 → Сorrection → Top 2 → 120-day range with a bull trap → dump → Manipulation → Accumulation Most people think the worst is already behind us, but if you compare it to 2022, this is exactly what the market looked like before the most painful part began Only after major manipulation did the market show real fear and most people capitulated I've told you this before, you need to remember that there are 3 phases: - Distribution - Manipulation - Accumulation Right now, the structure looks disturbingly familiar So far, all I see on the chart is manipulation aimed at taking liquidity from both longs and shorts Of course, the market doesn't have to repeat 2022, but the similarities are absolutely insane And if you hide the dates on both charts, the resemblance is way too strong to ignore I've said this before, and the cycle is still playing out exactly according to plan The problem is that most people will realize it too late because they're not following me Turn on notifications and drop your thoughts below The next phase is gonna be very important
Leni64,709 views • 21 days ago

I warned you about this scenario 3 times The bear flag is broken, and NEW LOWS are coming Bitcoin failed to hold the bear flag support zone and has already taken the liquidity from June 18 The structure is breaking down Do you know what this means for $BTC? - Next local stops: $60,679 - After that, it'll likely sweep the June 5 low at $59,100 - Globally, I'm watching for a reaction around the $57,500 level Nothing changes for me I've said this before, and everything is still playing out exactly according to plan Turn on notifications. If you're not following me yet, you might realize later that it was a mistake because I warned you Bookmark this. The next phase is gonna be very important
Leni22,270 views • 7 days ago


Just found a wallet that made over $700k on memecoins in a month. Its Token Winrate is a massive 97% — almost never loses! $MEDUSA $1.5k > $56k $MANYU $3.3k > $62.8k $RDOG $1.5k > $41k $MORUD $733 > $25k Most of the time, it buys at the stage when the token is starting to rise steadily. He doesn’t sit in the trenches — average buying price is around 300k mcap, but that doesn’t stop him from making money daily. In the past week alone, he made $211,402 trading just 48 tokens. Wallet: DNfuF1L62WWyW3pNakVkyGGFzVVhj4Yr52jSmdTyeBHm Today, I’m dropping a thread where I’ll talk about a few wallets and how to find similar ones. Wallets like this are pretty rare. Bookmark it so you don’t lose track.
Leni140,581 views • 1 year ago

Just found an insider who made $2M in one trade. #ZEREBRO bought for $8.2k, sold for $633k ($1.3M unrealized). $GOAT bought for $10.5k, sold for $143k ($286k unrealized). $POD bought for $300, sold for $14k. > Pretty interesting trading style: trades rarely but picks each move carefully. > Weekly win rate is 75%, thanks to the ZEREBRO and GOAT trades. > Keeps a small amount of SOL in the wallet to build up, then cashes out later. The wallet isn't meant for copy trading, but it's worth considering as a guide for your own moves. Also, I've added this wallet to my list because I like the trading approach—doesn’t go for 500-1,000 tokens a day. Wallet: 54siUULTj7aJbyqK9ZkrXDPuyr9Ub7T169a54gC2BLuX Used it for trading and analysis: Bookmark it so you don't lose track of it.
Leni52,923 views • 1 year ago
![How to find hidden gems with 5-10x potential every day. My standout calls prove it consistently: $FRED 900K > 270M (290x) $ASTRA 210K > 3.2M (14x) $ANGUS 330K > 3M (7x) $MIMI 200K > 1M (5x) All you need is GMGN and one tool. Open GMGN using the link: [link], and start analyzing the first tokens. In the Meme tab, set filters in the third column: > With at least 1 social > MKT Cap: min 150k > 1h TXs: min 300 > Total Holders: min 400 The dev should hold no more than 3-5% of the total token supply, or ideally 0%. Top 10 holders should control about 10-20%, which is reasonable for a market cap of 100-200k. Make sure most snipers have exited their positions. Check the top holders to see if they’re in profit or at a loss, and assess if they could create pressure on the chart. Also, see if those who bought tokens before their migration to Raydium have exited. Check all social media channels available, or find out the reason for the token's existence—whether it's due to news, TikTok, or simply a competent dev. Use TrenchRadar to confirm that the token wasn’t heavily bought by bots or that the current holdings aren't dominated by them. If everything checks out, look for an entry point and make your purchase. Bookmark this so you don’t lose it and can use it consistently.](https://image.24vids.com/tw-1861378968513060896/amplify_video_thumb/1861378817635557378/img/xTAdmdhsMjiO_6Zd.jpg)
How to find hidden gems with 5-10x potential every day. My standout calls prove it consistently: $FRED 900K > 270M (290x) $ASTRA 210K > 3.2M (14x) $ANGUS 330K > 3M (7x) $MIMI 200K > 1M (5x) All you need is GMGN and one tool. Open GMGN using the link: [link], and start analyzing the first tokens. In the Meme tab, set filters in the third column: > With at least 1 social > MKT Cap: min 150k > 1h TXs: min 300 > Total Holders: min 400 The dev should hold no more than 3-5% of the total token supply, or ideally 0%. Top 10 holders should control about 10-20%, which is reasonable for a market cap of 100-200k. Make sure most snipers have exited their positions. Check the top holders to see if they’re in profit or at a loss, and assess if they could create pressure on the chart. Also, see if those who bought tokens before their migration to Raydium have exited. Check all social media channels available, or find out the reason for the token's existence—whether it's due to news, TikTok, or simply a competent dev. Use TrenchRadar to confirm that the token wasn’t heavily bought by bots or that the current holdings aren't dominated by them. If everything checks out, look for an entry point and make your purchase. Bookmark this so you don’t lose it and can use it consistently.
Leni47,739 views • 1 year ago

The easiest way to find gems with 2x-10x potential. I've already proven this multiple times with my public calls: $Pnut from 1.5M > 2.1B ATH (1430x) $FRED from 900K > 270M ATH (290x) $ASTRA from 210K > 3.2M ATH (14x) $ANGUS from 330K > 3M ATH( 7x), and others. What do you need to start searching, analyzing, and trading? First and foremost, GMGN: This tool helps me find gems. Open the Meme tab and set up filters to eliminate the obvious trash. > With at least 1 social > MKT Cap: min 100-120k > Total Holders: min 150-200 > 1h TXs: 200 Next, we start analyzing tokens. First, check the volume—it needs to be high and stable for 5-10 minutes. Check if the dev still holds tokens. How much supply do the top holders have? 10-18% is a good range. Did snipers exit the trades? If most of them did, that’s good. What's the profit percentage of the top holders? 2000-5000% isn’t great—they could dump. Quickly check the token’s CA using TrenchRadar—there shouldn’t be clusters that bought up most of the supply. Also check the bubble map, just in case. Then, check social media—have there already been mentions of the token? Is someone shilling it? That’s good. Once all checks are done, find your entry point and SEND IT TO THE MOON. Bookmark this to come back later and find a gem.
Leni46,056 views • 1 year ago

I just found an insider who made $2M in a week! $BARSIK $1k > $937k $PIPPIN $8k > $545k $LUCE $2.6k > $430k > Got into $BARSIK very early and bought at a 65k market cap, ending up with massive profits > His style resembles trench trading, but he often searches for hidden gems, making sure the token is worth it > What I like most is that he catches huge X's by getting in early—keep this in mind. Make sure to check the tokens before buying and ensure it's worth it—don't blindly copy trades. For analysis and trading, I use: Bookmark this to avoid missing your potential profits.
Leni42,650 views • 1 year ago

Just found a Photon insider who made over $500k in a week. On top of that, he’s making $60-100k a day from memecoins. $KACY $2.5k > $89k $JUSTICE $1.2k > $34k $waterbear $2.6k > $27k $VS $500 > $20k Every day, he finds a token that makes him 5 figs in just a few hours. Not surprising, considering this trader spends a lot of time on trading. Analyzing his strategy, I noticed he’s really good at finding gems early—impressive. A solid option for copy trading, but with the right risk management. I use GMGN for trading and analysis: Wallet: 2cxjRs8bt5EBxbcSJkY1AXLX5UCYq23pWn83EckDMdCv Bookmark it so you don’t lose it and can use it later.
Leni26,741 views • 1 year ago
No more content to load