

XAPA
@xapa03 • 30,708 subscribers
BITCOIN OG SINCE 2013 03 | ₿ ₿ ALL IN IS THE KEY NFA join XAPA's world https://t.co/6atyr1dSg7
Shorts


Videos

Let’s briefly look back at what actually happened back then, before the breakout was visible, as in the August thread. In 2023, the final bottom formed 147 to 161 days after the wick outside the blue TEM zone. The 161 days are explained by COVID, the FTX crash, and a two-week delay with a price difference of less than 1%. What matters is the time interval itself. It took 245 days to reach the top. The move from the wick outside the blue TEM zone to the top was +43.5%. From the last low, Bitcoin pumped for three weeks, then moved sideways for three weeks, and after that consolidation gained more than +24% within one week. The impulse ended after exactly three weeks with the first sign of weakness and a pullback of -11%. The highest high formed in week six. After that, price dropped -22%. From the end of the three-week sideways phase to the peak, it took 42 days. In 2026, the final bottom formed 147 days after the wick outside the blue TEM zone. It took 231 days to reach the top, without the two-week delay from back then. The move from the wick outside the blue TEM zone to the top is +45.5%. Here as well, Bitcoin pumped for three weeks from the last low, then moved sideways for three weeks, and after that consolidation gained more than +24% within one week. After exactly three weeks came the first sign of weakness and a pullback of -9%. The highest high formed again in week six and therefore lines up with the current week. From the end of the three-week sideways phase to the peak, it again took 42 days. A final upside impulse is possible and cannot be ruled out. If the structure repeats 1:1, the local top is already in. The key levels are the 50-week EMA/SMA . If Bitcoin finds support there, the path toward $100,000 remains open! If the pattern repeats 1:1, Bitcoin would likely sit around $78–79k next week, then pump into $82/83k. What matters is whether this range holds. The pattern is too precise to dismiss as coincidence. bitcoin:native
XAPA57,597 Aufrufe • vor 17 Tagen

I’ve shown this pattern many times from different angles. Today, for the first time, it really hit me how insanely precise the percentage moves repeat on a weekly basis. This time without any indicators, purely from the UTXO Cross perspective. Measured from the TEM wick, Bitcoin put in a 36% pump between day 210 and 224. November $100,000+ if Bitcoin keeps repeating it the same way it has until now. holy bull.. 🐂 In June 2022, Bitcoin found its first low, only to form almost its final low 147 days later (on the weekly chart). At that time we were still in the Corona pandemic. Bitcoin fell by a maximum of 0.68% within two weeks to reach its "final" bottom. On November 9, 2022, the UTXO age bands cross occurred, a signal that has historically always predicted Bitcoin’s final bottom. After the final bottom we could observe Bitcoin moving sideways to the upside for three weeks, followed by three weeks of sideways movement to the downside. However, the bottom had already been formed. After these three weeks the Bitcoin bull run began. bitcoin:native
XAPA122,550 Aufrufe • vor 1 Monat

In June 2022, Bitcoin found its first low, only to form almost its final low 147 days later (on the weekly chart). At that time we were still in the Corona pandemic. Bitcoin fell by a maximum of 0.68% within two weeks to reach its "final" bottom. On November 9, 2022, the UTXO age bands cross occurred, a signal that has historically always predicted Bitcoin’s final bottom. After the final bottom we could observe Bitcoin moving sideways to the upside for three weeks, followed by three weeks of sideways movement to the downside. However, the bottom had already been formed. After these three weeks the Bitcoin bull run began! I see a similar pattern here for Bitcoin. There is NO reason, unless we see a scenario like the FTX crash and the coronavirus pandemic, to drop below $54,000. To understand, you have to check out the two pictures. " history doesn't repeat itself but it often rhymes " bitcoin:native
XAPA171,345 Aufrufe • vor 1 Monat

Measured from the point where the black bar left the overheated zone, it took exactly 20 hours for Bitcoin to reach its peak before the dump in 2023. The difference this time is that Bitcoin entered the overheated zone twice in 2026, so it took another 20 hours to form the next top. If the pattern repeats 1:1 without any deviation on the lower timeframe, Bitcoin could go sideways and drop a bit before pumping back to 87/88k and then dumping at the start of next week or the top was already formed yesterday at 87,330. Since this is a high-timeframe (1W) pattern, delays or deviations may occur on lower timeframes than 1W. It doesn't necessarily mean it has to happen again! bitcoin:native
XAPA64,263 Aufrufe • vor 22 Tagen

Thanks to everyone who started following me recently! A lot of you are more interested in Ethereum, Solana, and other altcoins than in Bitcoin right now. So I’ve decided to start posting about the coins you actually want to see. I have bought Ethereum over the last few days. DCA would be the smart move. Red circles = bearish signals (price likely going down) Green circles = bullish signals (price likely going up) I don't think Ethereum will fall below $1,000, as many people claim. I can't even imagine ETH dropping below $1,500. What we are currently seeing with Ethereum is an exceptionally strong accumulation phase. It is only a matter of time before the bears melt. The last bull run has been disappointing for many ETH holders so far, but this is just the quiet phase before the real move. Ethereum still has a good chance to reach 5-figure prices in the next 3 years! (10.000 $+) This indicator simply shows how institutional investors are positioning themselves and was created by At the Bitcoin Frontier 🦅 Leave him a follow, he deserves it. ethereum:native
XAPA134,570 Aufrufe • vor 1 Monat

The bullish crossover printed yesterday. Since then Bitcoin has taken the $77,000 area and is still holding it. In September, Bitcoin could see $82,000, then dump toward $73,000–$74,300, pump into the high $80k's around $86–87k, dump again back to $68–69k into October, and reach the high $90k's in November. If we repeat the pattern perfectly by percentage, $100k+ could be hit as well, but I do not believe it. $90k+ is realistic! If this pattern plays out, Bitcoin will fall from a negative December into January. I expect the cross of the RCI3L Sinus indicator in January. After that, Bitcoin continues the run toward a new all-time high in 2027. After the 2016 halving, the time until the indicator crossed was 1,036 days. After the 2020 halving, it was 994 days. I expect the cross by January, followed by an all-time high in 2027. As I wrote in a thread a few days ago: “ As long as the $77,000 level holds, I expect the $80k range to be reached again before a move toward $72,000–$75,000. ” I also publicly called the local top at $82k in May and warned of a final crash into August. ✅ 750D after halving = downtrend, local top was around 82k+ ✅ shorted it public 🎯 You have to watch the end of the video to understand what I am trying to explain with the RCI3L Sinus. bitcoin:native
XAPA96,858 Aufrufe • vor 1 Monat

I’ve been mapping this HTF pattern onto the LTF for weeks now, with very high precision. Delays can still happen because this is an HTF pattern on the weekly timeframe. After I said Bitcoin would reach the $84,600–$85,600 zone and get rejected there and it played out exactly that way, I want to explain why I thought that and what I expect next. Measured from the number 8 (you see the pattern on the 8H timeframe, but the overall pattern in this video was drawn on the 3D timeframe), one day before the breakout, it took 24–27 days for Bitcoin to find its low. Bitcoin still needed a maximum wick into the orange zone between $84,600 and $85,600. You can see that in 2023 the wick into the orange zone happened, and the next 8-hour candle pumped only 0.41% and got rejected below the orange TEM zone. You can follow the rest of the move in the video. The same scenario played out again today. Exact wick into the orange TEM zone, then the next 8H candle started bullish with a +0.40% pump and got rejected below the orange TEM zone. $85,600 was hit, euphoria kicked into the market, impatience got punished, and late longs are now trapped. If the pattern continues to play out on the LTF with the same high precision, I first expect a drop to $82,300, followed by another drop toward $80,000. If it plays out that way, I expect a wick above the orange zone once again, before it drops further towards the $79,000–$75,000 range. It’s not the time to be bearish. Bitcoin looks extremely strong, the $82,000–$83,000 zone is holding beautifully. I still expect Bitcoin to drop below $80,000, but I’m not betting on it. I’m preparing for the next brutal pump and will start building my swing position. Because the TEM zones move with price and levels can shift, the targets can change as well, I’ll keep posting daily updates. It doesn't necessarily mean it has to happen again! Since this is a high-timeframe (1W) pattern, delays or deviations may occur on lower timeframes than 1W.
XAPA33,938 Aufrufe • vor 13 Tagen

At the start of this video you’ll see exactly what I showed you yesterday! Measured from its low, Bitcoin showed weakness 18–20 hours later before the rally resumed. In 2023, 18–20 hours after the local bottom had formed, the move measured from the low up to that candle was only +0.81%. That’s why the target was $75,000 and that level had to hold and it did. The second photo is a 4h timeframe to show you the further development as a comparison with 2023. On the last photo, which is the 2h timeframe, you can see that I had expected Bitcoin to stop at $75,000 after an approximately 0.81% drop. What comes next is a push toward $80k+, followed by a move back toward $71k. If the same time interval repeats, the first breakout should hit Thursday afternoon and run through the end of the week. A new local high is likely to form from here. It doesn't necessarily mean it has to happen again! Since this is a high-timeframe (1W) pattern, delays or deviations may occur on lower timeframes than 1W. bitcoin:native
XAPA63,131 Aufrufe • vor 27 Tagen

In this video, I’m showing you Bitcoin on the Thermo-Dynamic Engine Model (TEM). You can clearly see that whenever Bitcoin moved into the blue zone on the 1W chart, the bottoming phase began. On the 10D chart, this is even more obvious! Historically, Bitcoin has touched this zone one more time before the bullrun started. At the end of the video, you’ll notice that Bitcoin left the yellow zone only once, during the FTX crash and the COVID pandemic. expecting first a move toward $69,000, followed by a short correction, and then the next leg up toward $82,000. coded by At the Bitcoin Frontier 🦅 bitcoin:native
XAPA121,933 Aufrufe • vor 1 Monat
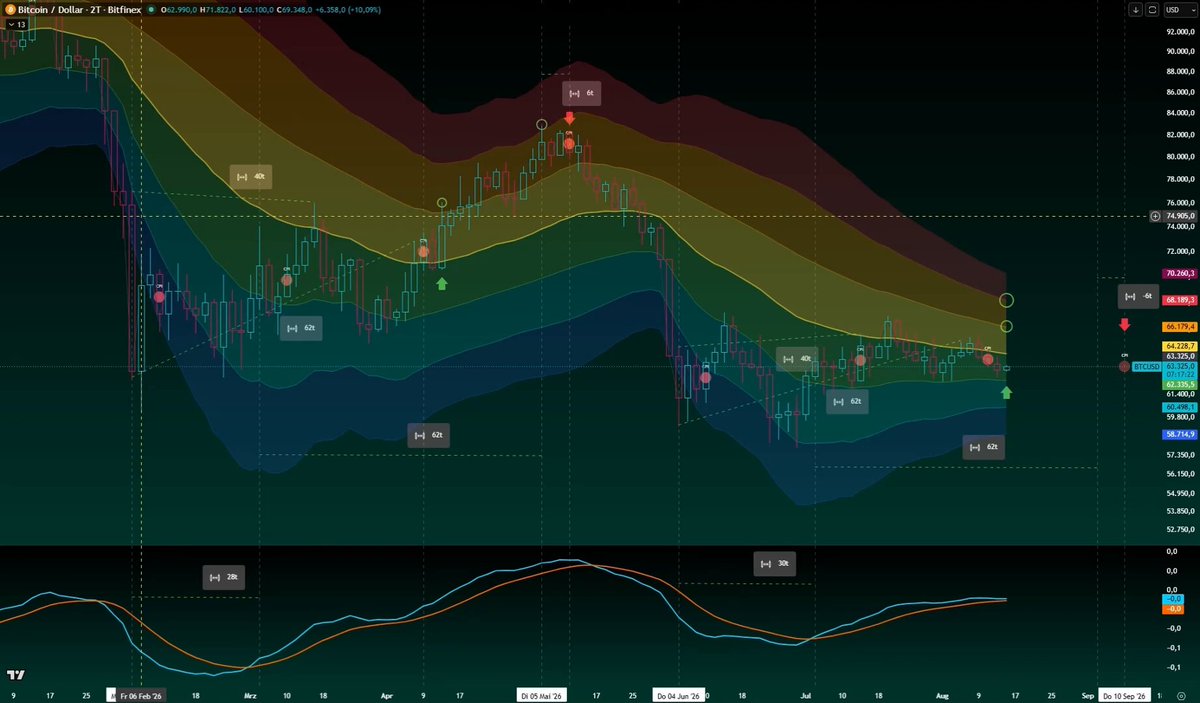
From the red candle outside the TEM until Bitcoin first touched the yellow zone it took 40 days, and that was followed by a correction into the light blue TEM area. Measured from the same point outside the TEM, it then took 62 days to touch the yellow line again. After those 62 days we only saw a minor correction that never left the green zone, which is a strong support area. CPI data releases happened at both of these points. Overall it took 90 days on the 2D chart to reach the red TEM zone, just 6 days before the CPI release. If this pattern repeats, the top would form around early September. The potential target zone sits between $66,500 and $68,300, with $67,300 acting as a very strong resistance. As additional confirmation you can see that a bullish crossover formed on the lower indicator around the same timeframe. Nothing necessarily has to be repeated, some things take longer, while others happen faster. Everything is based on probabilities. " now from top to bottom -> 13d -> DSS cross -> pumped 2 days now -> waiting for rejection around $64.780 to $65.300 ✅ -> small dump around 3,5/5% ✅ -> pump to a new local high ⌛️" bitcoin:native
XAPA126,469 Aufrufe • vor 1 Monat

It's looking very similar to me. The same pattern on the 3D view. I don’t expect a sharp dump and currently don’t see Bitcoin going below $70,000, though it can’t be ruled out. Candle 4 = high Candle 8 = low At exactly the same time! On the 3D timeframe, the day falls on a Sunday. I already showed you the time intervals in the previous post. If it repeats: Rejection at 82k bottom Oct 7 around 70.5k 90k+ by early November " If the $75k area is lost, $73,000–$73,900 are the next targets where I’ll add more to my long. " Since this is a high-timeframe (1W) pattern, delays or deviations may occur on lower timeframes than 1W. It doesn't necessarily mean it has to happen again! bitcoin:native
XAPA59,550 Aufrufe • vor 28 Tagen

Dear bears, the bear market is over and the bottom is in. Back in May I publicly called the bottom for July 1st. Let me show you a clear video that probably won’t improve your mood. Stay stubbornly on the sidelines if you want. Calling $62,200 as the final low. ⌛️ New all time high by 2027. ⌛️ We’re in the early stage of a bull run.🖐️ When the TEM wick printed (marked with the circle), it took 147 days until Bitcoin put in its final low. In 2022 the price difference between the 147-day and 161-day mark was less than 1%, even with the FTX crash and the lingering corona pandemic effects. The Bitcoin Journey Map shows that once 112 days had passed, the final bottom was in and that price zone was NEVER touched again. That means we never see $62,200 again unless a real black swan hits. That’s now what most of you bears are betting on, because the original plan didn’t work out. The exact same pattern is playing out right now. the genius behind these masterpieces is he deserves every follower, the content he puts out is next-level At the Bitcoin Frontier 🦅 bitcoin:native
XAPA78,505 Aufrufe • vor 1 Monat

Every time the DSS Bressert crossed up on the 4-day timeframe, a big pump followed. Bitcoin hit its lowest price in November 2022. On the 4-day chart it took almost 53 days for the DSS Bressert to make a bullish crossover. After that Bitcoin pumped hard. The DSS Bressert is near the capitulation level (the red line). The bullish crossover started from there. That is why I show this example. I already showed in several threads with other indicators that Bitcoin has bottomed. The current behavior looks a lot like 2019 and 2022. Here I focus only on the 2022/2023 period. Even the slightest correction should be taken seriously when it comes to long-term investments. bitcoin:native
XAPA79,365 Aufrufe • vor 1 Monat

Measured from the wicks outside the blue box, the time axis has repeated 1:1. Back in 2023 the dump came within 2–3 days and landed exactly into Sunday, exactly like today. If the pattern continues this precisely, the last dump can rather be expected into Monday. A move toward $75,500 would not be unrealistic there, before it heads toward $87,000 afterward. I will add more to my long position between $73k and $75.5k. Since this is a high-timeframe (1W) pattern, delays or deviations may occur on lower timeframes than 1W. It doesn't necessarily mean it has to happen again! bitcoin:native
XAPA57,275 Aufrufe • vor 1 Monat

If Bitcoin loses the $78,500 level, the next support is at $76,500. If this pattern repeats, Bitcoin should find support at $76,500 and resume its trend toward the $80k+ level. First part (around January 2023) Strong upside breakout with a gain of +23.32%. This was followed by a correction of about –5.24% into the red TEM zone. The last wick that clearly sat outside or at the edge of the red TEM band appeared after roughly two days. After that the price consolidated inside the TEM bands and continued the uptrend. Final support on the 4H timeframe was found at the Ichimoku Cycle Engine / yellow TEM band. Second part (current chart, August 2026) strong upside breakout with a gain of +23.58%. This was followed by a correction of about –4-5% into the red TEM zone. The last wick that clearly sat outside of the red TEM band appeared after roughly two days. After that the price consolidated inside the TEM bands and continued the uptrend. However, this does not mean the pattern is guaranteed to repeat. bitcoin:native
XAPA83,127 Aufrufe • vor 1 Monat

In this video, you are looking at the Ichimoku Cycle Engine, coded by At the Bitcoin Frontier 🦅 There is a good chance that Bitcoin could reject around $73,000 to $74,500. The moment Bitcoin succeeds in reclaiming this zone serves as a warning signal to all bears. the bull rally is imminent. I’ll keep it short, as the video is very easy to understand. bitcoin:native
XAPA92,618 Aufrufe • vor 1 Monat

Every time the LMACD Indicator crossed up on the 5-day timeframe, a big pump followed. When Bitcoin was outside the TEM bands, it took 220 days for the bullish crossover to form. 95 days later, Bitcoin left the red TEM zone and a correction followed before the next pump. I’ve already shown in several threads with other indicators that Bitcoin has bottomed. Current behavior looks a lot like 2019 and 2022. Here I focus only on the 2022/2023 period. history doesn't repeat itself but it often rhymes Even the slightest correction should be taken seriously for long-term investments. bitcoin:native
XAPA64,787 Aufrufe • vor 1 Monat

According to this indicator, Bitcoin is currently in the final phase of its bottom formation and the final phase of capitulation. Historically, this setup has marked the transition from the final capitulation phase into the start of the next bull market. In 2019, we dumped into February 14th, exactly like today. Check out my previous thread about the Market Cipher! “ Historically, whenever the blue line has broken through the green vertical line, it marked the end of the bear market for Bitcoin. In the last two bear markets, the final bottom occurred exactly one week later, just before the bull run began. I have also given you three examples comparing 2018/2019 with 2026. Since we had already established the final bottom in 2018 before the bull run began in 2019, we could be facing exactly that kind of situation again. Judging by this indicator, that date falls on August 20th.” bitcoin:native
XAPA72,985 Aufrufe • vor 2 Monaten

Anyone remember 2019, when Bitcoin pumped straight from $3k to $14k? Do you remember how, out of pure nothing, it just decided to start its own rally in 2019? 2018 Bitcoin printed its absolute low. You can see that 112 days after we had turned from red to green in the Bitcoin Journey Map, the absolute cycle bottom had been formed. The real bottom had already formed before the rally. The weekly chart printed a clean bullish crossover, and after that Bitcoin only knew one direction. 2022 was almost the identical setup. Same bullish weekly crossover. Inside those 112 days we actually saw the lowest price of the entire cycle. 2019 was the only exception where the low printed earlier. In 2019 that leg from $3k to $14k took 63 days. That $14k level was roughly 27 percent under the previous cycle top. If this pattern repeats now the same way it did in 2019, we are looking at $90,000 by mid-October. Everything is based on probabilities! bitcoin:native
XAPA50,072 Aufrufe • vor 1 Monat

I decided to update this video for you by showing the timeframes when Bitcoin pumped in 2023 and when it reached its peak price. Bitcoin is currently behaving in exactly the same way. The pattern is very similar and has repeated itself perfectly so far. If the rest of the pattern plays out, prices between $83,300 and $91,000 can be expected. If the timeframe repeats, it could happen in mid-September. Nothing is guaranteed to repeat, of course, but it is a very interesting perspective. Check out my previous thread to understand more! First part (around January 2023) Strong upside breakout with a gain of +23.32%. This was followed by a correction of about –5.24% into the red TEM zone. The last wick that clearly sat outside or at the edge of the red TEM band appeared after roughly two days. After that the price consolidated inside the TEM bands and continued the uptrend. Final support on the 4H timeframe was found at the Ichimoku Cycle Engine / yellow TEM band. Second part (current chart, August 2026) Strong upside breakout with a gain of +23.58%. This was followed by a correction of about –4-5% into the red TEM zone. The last wick that clearly sat outside of the red TEM band appeared after roughly two days. After that the price consolidated inside the TEM bands and continued the uptrend. bitcoin:native
XAPA38,573 Aufrufe • vor 1 Monat