
Evan Applegate
@youwillmakemaps • 11,307 subscribers
Vocational cartographer, design @durinmining • https://t.co/X5SvX8aR3h • The best maps lie ahead, and you’re going to make them
Shorts


Videos


"I need to grab weather radar data via API, generalize it into fake clouds, place them on a mapbox map, add shadows and an offset so it looks like they're floating above the surface" GPT 5.1 Codex: "That will take months" Gemini 3 Pro: "Sure here you go" ??? I don't get LLMs
Evan Applegate236,856 views • 9 months ago


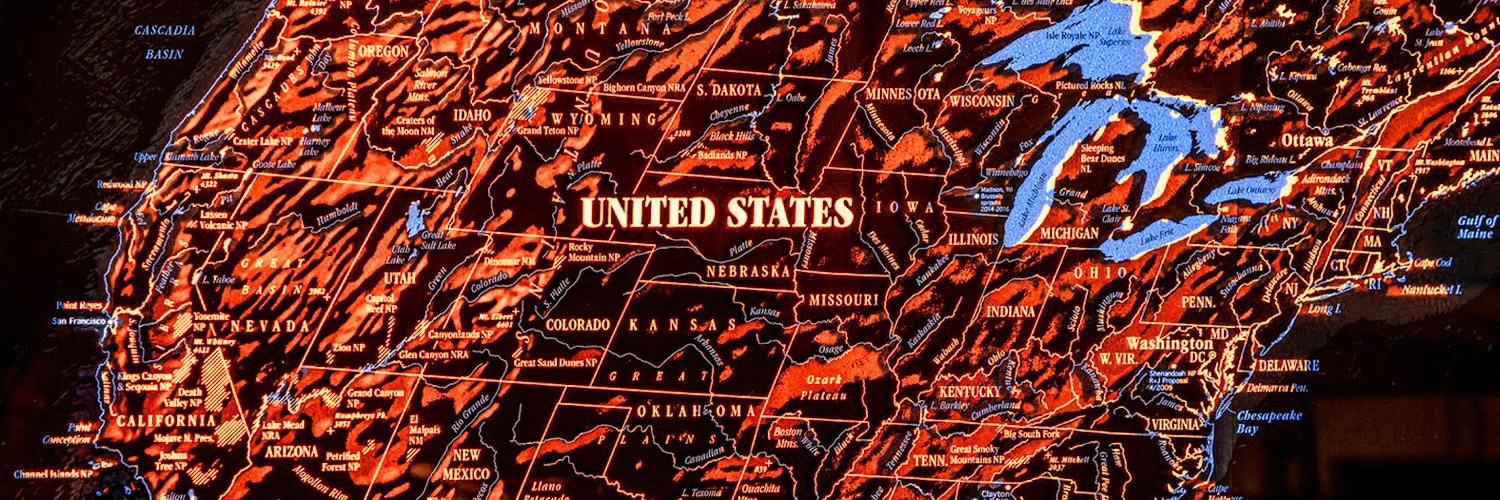
"Ghost in the Shell 2: Innocence" had the best burning-amber UIs
Evan Applegate81,605 views • 5 months ago


It is civilization-grade low hanging fruit to make anything you can more beautiful
Evan Applegate32,992 views • 5 months ago

![Here's a copy/paste prompt recipe and vid showing exactly how to ask an LLM for an interactive map with satellite/map layers + a georeferencer that lets you see how old maps correspond with modern geography. Today the computer can’t make good print maps (that's your hill to climb ) but it can, with five bucks and twenty minutes, make good interactive maps. No software/GIS knowledge necessary, you just need a few nouns and an LLM. Scroll to the bottom for the repo/live map if you want those. I'm using Claude Code as an extension in VS Code but you can use the Claude CLI, Cursor, whatever. 1) Let's grab an old cadastral map and see who owned big tracts of a city; I found this an 1854 map of Niagara Falls, NY I found in the Library of Congress: , grabbed the .jp2, saved as a jpg from photoshop. 2) Let's ask Claude Code for a map. You can see exactly what I did in the video but my prompt, sans simple "hey it's busted" debugging, is written out in the following paragraphs. I explain the map-specific nouns in brackets. You can likely dump this whole thing in your LLM window and it'll work; I'd try plan mode + skip permissions. THE PROMPT Make an interactive map with MapLibre GL JS [maplibre is a javascript mapping library, a FOSS version of Mapbox GL JS. This lets us display tiled map data and arbitrary images on the map] Add basemap toggles with Esri satellite, Carto Positron, and OSM [these map layers require no API keys for light usage; Carto Positron is a nice road map layer and OSM is ugly but comprehensive] Add a globe/mercator projection toggle [I think the globe looks better at low zooms] Add a layer panel on the left with visibility checkboxes and delete buttons. Add a search box on the map that flies to results, with deletable pin markers [Makes this easy to get to your area of interest] Include an interactive local georeferencer: drop a JPG, pick ground control points on a zoomable/pannable image viewer, place them on the map, watch it warp with a progress bar centered on the map. [The georeferencer uses math ("affine transform"??) to match points on the old map to points on the new map; generally you click road intersections on the old map, match them on the new map, repeat a dozen times and everything aligns] The georeferenced map overlay defaults to 25% opacity with a slider above the control point list. [I want it easy to see the underlying modern geography] Add Export/import control point buttons [this saves the control points as a JSON so you can save and reimport your work] Add a button to export the warped image as a GeoTIFF with a .prj [In case you want to add the georeferenced image to a real GIS program like QGIS] Look up all relevant docs before starting [Claude sometimes uses outdated stuff] Split everything into separate HTML/CSS/JS files [Claude tends to pile everything in index.html, which is hard to read] Use Optima font, base color #FEFAF6 [I just like this style] Let me test with a local server [it serves it on a simple server so you can nav your host to localhost:8000 and try it out] Log all errors [so you don't have to play telephone with the LLM describing what's busted] 3) Once your LLM finishes, test it out in your browser; if it doesn't work, ask the LLM to check logs. Repeat 'til functional. 4) After this works on your computer, you can show it to everyone by hosting it on GitHub: prompt with "write a README explaining what everything does, add it to a new GitHub repo, deploy using GitHub pages, gimme the live URL" Here's what Claude made for me, try it yourself: • Upload the JPG in the repo, which is linked below • "Add GCP" • Click somewhere recognizable on the old map, like the tip of an island or a road intersection • Click the matching point on the new map • Repeat til you have least 3x points • Hit "georeference" • You'll see the old map atop the new map; if you want a better fit, delete bad points or add a dozen new ones, hit georeference again, repeat Repo: Is this map robust? Human-maintainable? Elegant? Performant? Secure? No, but *your* personal web map need not be. It just needs to work for *your* narrow use case, because it’s *your* map.](https://image.24vids.com/tw-2034005299972174112/amplify_video_thumb/2034000250713870337/img/BT1RIvJqMcNZrhwG.jpg)
Here's a copy/paste prompt recipe and vid showing exactly how to ask an LLM for an interactive map with satellite/map layers + a georeferencer that lets you see how old maps correspond with modern geography. Today the computer can’t make good print maps (that's your hill to climb ) but it can, with five bucks and twenty minutes, make good interactive maps. No software/GIS knowledge necessary, you just need a few nouns and an LLM. Scroll to the bottom for the repo/live map if you want those. I'm using Claude Code as an extension in VS Code but you can use the Claude CLI, Cursor, whatever. 1) Let's grab an old cadastral map and see who owned big tracts of a city; I found this an 1854 map of Niagara Falls, NY I found in the Library of Congress: , grabbed the .jp2, saved as a jpg from photoshop. 2) Let's ask Claude Code for a map. You can see exactly what I did in the video but my prompt, sans simple "hey it's busted" debugging, is written out in the following paragraphs. I explain the map-specific nouns in brackets. You can likely dump this whole thing in your LLM window and it'll work; I'd try plan mode + skip permissions. THE PROMPT Make an interactive map with MapLibre GL JS [maplibre is a javascript mapping library, a FOSS version of Mapbox GL JS. This lets us display tiled map data and arbitrary images on the map] Add basemap toggles with Esri satellite, Carto Positron, and OSM [these map layers require no API keys for light usage; Carto Positron is a nice road map layer and OSM is ugly but comprehensive] Add a globe/mercator projection toggle [I think the globe looks better at low zooms] Add a layer panel on the left with visibility checkboxes and delete buttons. Add a search box on the map that flies to results, with deletable pin markers [Makes this easy to get to your area of interest] Include an interactive local georeferencer: drop a JPG, pick ground control points on a zoomable/pannable image viewer, place them on the map, watch it warp with a progress bar centered on the map. [The georeferencer uses math ("affine transform"??) to match points on the old map to points on the new map; generally you click road intersections on the old map, match them on the new map, repeat a dozen times and everything aligns] The georeferenced map overlay defaults to 25% opacity with a slider above the control point list. [I want it easy to see the underlying modern geography] Add Export/import control point buttons [this saves the control points as a JSON so you can save and reimport your work] Add a button to export the warped image as a GeoTIFF with a .prj [In case you want to add the georeferenced image to a real GIS program like QGIS] Look up all relevant docs before starting [Claude sometimes uses outdated stuff] Split everything into separate HTML/CSS/JS files [Claude tends to pile everything in index.html, which is hard to read] Use Optima font, base color #FEFAF6 [I just like this style] Let me test with a local server [it serves it on a simple server so you can nav your host to localhost:8000 and try it out] Log all errors [so you don't have to play telephone with the LLM describing what's busted] 3) Once your LLM finishes, test it out in your browser; if it doesn't work, ask the LLM to check logs. Repeat 'til functional. 4) After this works on your computer, you can show it to everyone by hosting it on GitHub: prompt with "write a README explaining what everything does, add it to a new GitHub repo, deploy using GitHub pages, gimme the live URL" Here's what Claude made for me, try it yourself: • Upload the JPG in the repo, which is linked below • "Add GCP" • Click somewhere recognizable on the old map, like the tip of an island or a road intersection • Click the matching point on the new map • Repeat til you have least 3x points • Hit "georeference" • You'll see the old map atop the new map; if you want a better fit, delete bad points or add a dozen new ones, hit georeference again, repeat Repo: Is this map robust? Human-maintainable? Elegant? Performant? Secure? No, but *your* personal web map need not be. It just needs to work for *your* narrow use case, because it’s *your* map.
Evan Applegate15,772 views • 5 months ago

Tom Patterson Tom Patterson is right: this is the golden age of cartography. We have infinite data, tools that let you filter terabytes on someone else's computer, and language models to format your queries. I used all that to make a quick retro poster of the Lower 48, something like a 1987 USGS giveaway you’d see on a classroom wall: 1) Google Earth Engine to filter 2013-2024 Landsat 8 scenes, filtered out clouds + cloud-shadows using the "QA_Pixel" band. You get some striping but for this purpose it looks fine. 2) Exported 4x composite images at 1500m resolution, one for each season: autumn, winter, spring and summer 3) Used Eduard to grab a ~300m Mapzen DEM over the continental U.S., cranked up the generalization 4) Match up projections and resolutions in GDAL (went with EPSG:5070, CONUS Albers) 5) Stacked everything in Photoshop, to get that retro look my layers were ordered thus: Levels adjustment layer Imagery layer: 60% opacity, color burn Shaded relief layer underneath 6) Export each to it’s own TIFF 7) Place an Albers raster in a MAPublisher layout, use the MAP View to add my country-outline clipping mask and state boundaries 8) Dupe the MAP Views, replace the geoTIFF with my photoshop output 9) Design work: Franklin Gothic type, added small strokes to the text and blurred the final output a bit to make it look old
Evan Applegate11,934 views • 1 year ago
No more content to load