Loading video...

Video Failed to Load

Go Home

1/ Volatility affects gamma by flattening its curve. When volatility is high, gamma spreads out over a wider range of strike prices. This means the change in delta occurs more gradually. Great visualization 📽️

1,878,170 views • 1 year ago •via X (Twitter)

10 Comments

Menthor Q's profile picture
Menthor Q1 year ago

2/ A lot of FREE material here covering option valuation, greeks and risk management. Link 🔗

RedEngineer's profile picture
RedEngineer1 year ago

I would pay for a service that modeled these in the form of trades like an atm spx butterfly. I have spreadsheets but I would love to see animation.

Menthor Q's profile picture
Menthor Q1 year ago

Soon

Konstantinos's profile picture
Konstantinos1 year ago

Or put in a different way, the tails become fatter

Financelot's profile picture
Financelot1 year ago

Interesting choice of classical song 🤣

Menthor Q's profile picture
Menthor Q1 year ago

lol

BoxBrook's profile picture
BoxBrook1 year ago

I had one of those but the wheels fell off.

Jeff Joseph Mathew's profile picture
Jeff Joseph Mathew1 year ago

Can i use your products in Indian markets ?

ochlocracy's profile picture
ochlocracy1 year ago

The most informative thing you've every posted. 🍸👍

Menthor Q's profile picture
Menthor Q1 year ago

Thank you 😀
Related Videos

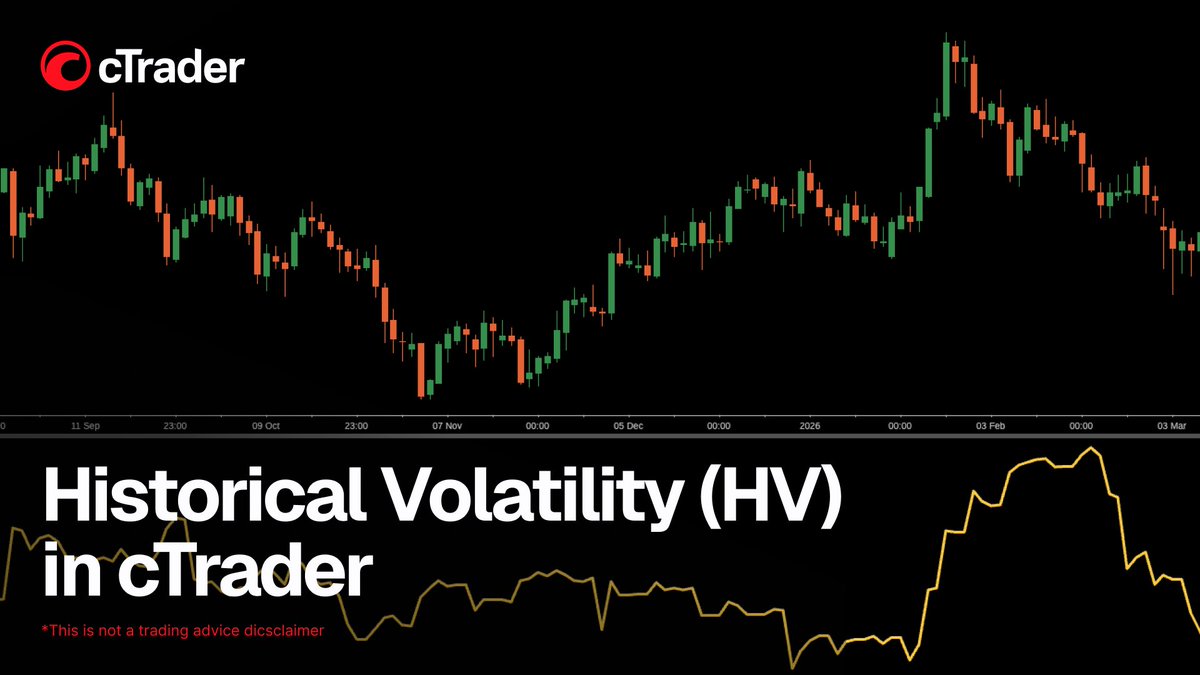
🎥 Historical Volatility (HV) in cTrader - how it works and how to use it In this video, we explore Historical Volatility (HV) in cTrader - an indicator that measures past price fluctuations over a specific period, helping traders understand market variability and risk. You’ll learn where to find the Historical Volatility indicator in cTrader, how it is calculated using logarithmic price returns, standard deviation and annualisation, and how to customise settings such as standard deviation and bar history. We also look at how traders use HV to: • Identify rising volatility and expanding market swings • Recognise falling volatility and quieter market conditions • Confirm breakout conditions and trend continuation • Adjust protection and stop-loss placement based on market volatility • Combine HV with indicators such as ADX or moving averages • Use HV in cBots 📍 Timecodes 00:09 – Introduction: what is Historical Volatility (HV) 01:14 – Where to find Historical Volatility and how to customise its settings 01:34 – How Historical Volatility helps identify changing market conditions 02:29 – Using HV to confirm breakouts and trend continuation 03:39 – Using volatility to adjust protection and stop-loss placement 05:08 – Combining HV with other indicators and using it in cBots - Learn more about the Historical Volatility - - Join Discord - Don’t forget to like and share your thoughts in the comments! _____________________________________ 👉 Start Trading with cTrader - 👈

cTrader

11,498 views • 5 months ago

If You Want to Finally UNDERSTAND how to use GAMMA EXPOSURE (GEX) , just Imagine Walking Into a Bread Shop🥖 A introduction to how to ACTUALLY trade with GEX Every morning on your way to work, you stop by the same neighborhood bakery. For days, you've noticed the baker puts exactly 10 loaves of bread on the shelves before opening. It's consistent. Every day, there are 10 loaves available for customers to buy. Then one Sunday, something changes. Instead of putting out 10 loaves, the baker stocks 100 loaves before opening. That should immediately catch your attention. Why? Because the baker is increasing the amount of product available for customers to purchase. He has supplied more inventory because he expects more demand. If he didn't believe more customers were coming, there would be no reason to fill the shelves with ten times as much bread. Now think of the baker as the market maker. The bread is liquidity. The customers are traders. When Daily Net Gamma increases, market makers are doing something similar. They are increasing their long gamma exposure, which adds liquidity to the market. Just like the baker stocked more bread, market makers are supplying more liquidity because they anticipate increased buying activity. Now imagine the opposite. You walk into the bakery expecting the usual 10 loaves, but instead there are only 5. The baker hasn't run out of bread by accident. He's chosen to supply less inventory because he expects fewer customers. He's reduced the amount of product available. That reduction tells you something about his expectations. The same principle applies to Daily Net Gamma. When Daily Net Gamma decreases, market makers are reducing long gamma or increasing short gamma, removing liquidity from the market. Just as the baker stocked fewer loaves because he expected less demand, market makers are supplying less liquidity because they expect weaker buying. I use it to understand what market makers are expecting. An increase in Daily Net Gamma tells me dealers are adding liquidity, creating a more supportive environment for bullish price action. A decrease tells me they're removing liquidity, creating an environment where bullish moves have less support and downside risk becomes more likely. The final step is confirmation. Just because the baker stocked 100 loaves doesn't guarantee customers will buy them. You still have to watch people walk through the door. In the market, that's Net Volume. If Daily Net Gamma is increasing and Net Volume begins expanding positively, market makers' expectations are being confirmed by actual buying. If Daily Net Gamma is decreasing and Net Volume turns increasingly negative, the reduction in liquidity is being confirmed by selling pressure. Daily Net Gamma tells you what the market maker expects. Net Volume tells you whether the customers actually showed up. When you understand the relationship between those two, you're no longer guessing where the market might go. You're reading the expectations of the market makers and waiting for traders to confirm them.

Scholar

42,806 views • 18 days ago

This order book depth creates exactly the kind of fragile setup where a sudden shock could easily trigger a major, sharp and accelerated correction. Here’s why the risk is real right now: 1) Liquidity vacuum: Top of book depth in ES futures is sitting at ~$5.1M levels an 80% collapse from the start of 2026 and right back at the stressed lows seen during the April 2025 “Liberation Day” volatility spike. Even modest selling flow has far fewer resting bids to absorb it. 2) Markets are rallying into thin book: SPX closed today around 6,783 (+2.5%), with ES hovering near 6,800–6,825 on the ceasefire relief news. A rally built on thin liquidity is the textbook setup for an “air pocket” drop if sentiment flips dealers aren’t providing the usual cushion. 3) Geopolitical cliff in 48 hours: There are talks scheduled in Islamabad on April 10. If they fail, escalation resumes hitting the order book that now can’t absorb the flow. 4) Post OpEx volatility tailwind: April monthly expiration is April 17. We’re already seeing the gamma roll off begin, shifting the market into a more negative gamma near current levels. That amplifies moves in either direction once the gamma wall loosens. 5) Income Tax deadline: April 15 is the deadline for U.S. taxes. A major drain on liquidity in both the stock market, banks and financial system as a whole. The structural vulnerability in thin depth + upward drift + looming catalyst means any sudden shock like failed talks or a sudden ground invasion of Iran has a much higher probability of producing a gap down or cascading sell off than it would in a normal liquidity environment. The move would be faster and deeper than the headline alone would justify, possibly producing a 2020 flash crash scenario.

Financelot

180,626 views • 4 months ago