Video yükleniyor...

Video Yüklenemedi

Ana Sayfaya Dön

Bitcoin price crashed into the mid-80Ks and it felt violent for a reason. This wasn’t random selling. It was a leverage snap layered on top of a confidence hit. When long positioning gets crowded, price doesn’t slide. It drops until forced selling is done. Now the part that actually...

46,429 görüntüleme • 6 ay önce •via X (Twitter)

0 Yorum

Yorum bulunmuyor

Orijinal gönderinin yorumları burada görünecek

Benzer Videolar

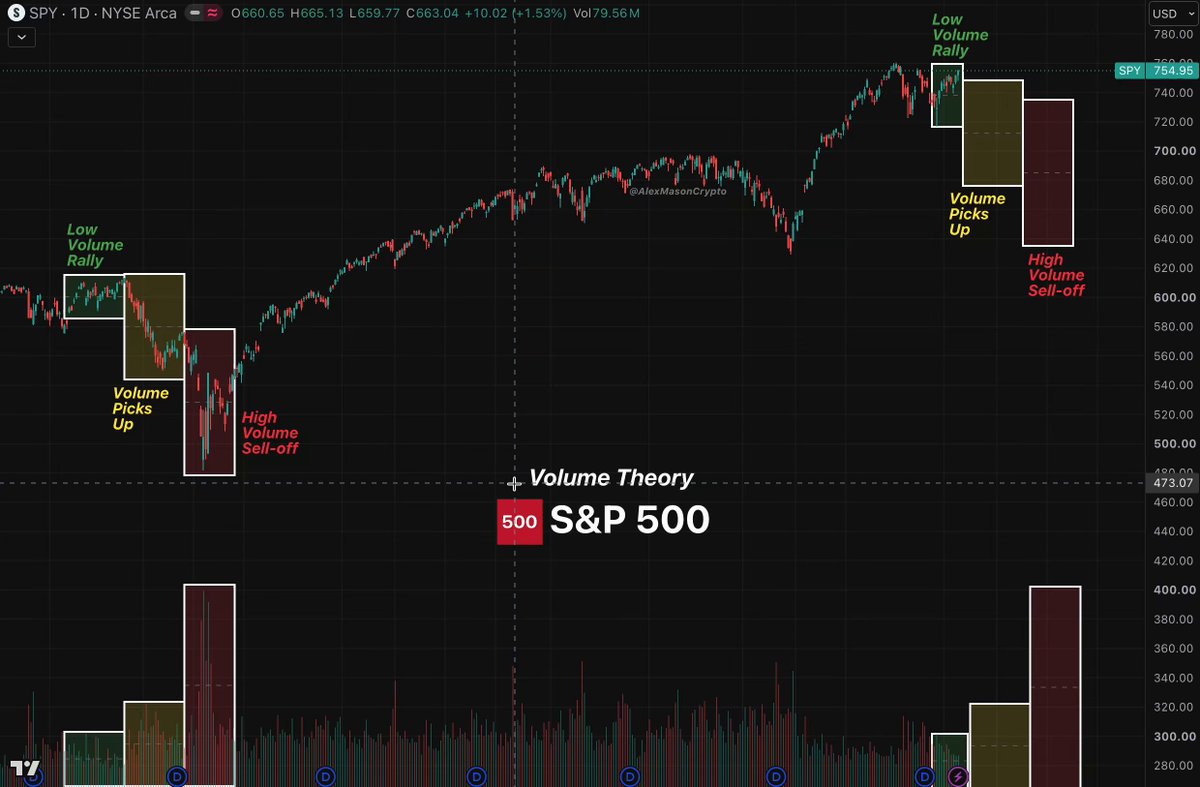
🚨 THIS IS NOT NORMAL The stock market is about to repeat history. US MARKET HAS NEVER BEEN THIS OVERBOUGHT IN HISTORY. The setup is IDENTICAL. Every single time the MACD turns, the S&P-500 has a massive crash. I spent 14 hours researching this, and you MUST know what comes next: Back in 2000, markets looked unstoppable. Momentum was strong. Confidence was high. And then everything broke. Billions were erased. Portfolios were crushed. And the dump was brutal. Right now, the chart is lining up almost point for point. Same breakout. Same overextension. Same false sense of security. And the warning signs are flashing. Valuations are stretched. Liquidity is tightening. Volatility is waking up. And risk is building underneath the surface. Most investors still don’t see it. Because at the top, everything feels normal. That’s how every major correction starts. Optimism peaks. Positioning gets crowded. And complacency takes over. Then the reversal begins. Fast. And once momentum flips, there is no gradual exit. There is only repricing. The market does not wait. It resets. And when it does, it moves violently. Right now, there are three paths ahead: 1⃣ SOFT RESET The market cools off. Valuations compress. Momentum stabilizes. 2⃣ DEEP CORRECTION Selling accelerates. Fear returns. Risk assets dump lower. 3⃣ FULL DOT-COM STYLE COLLAPSE Support breaks. Panic spreads. Liquidity disappears. Forced selling takes over. That is where real damage happens. Because when leverage unwinds, everything gets hit. Stocks. Crypto. Speculative assets. EVERYTHING. The chart is there. The setup is there. And history is staring investors in the face. Watch price action. Watch liquidity. Watch volatility. Because if this pattern completes, the next move will be impossible to ignore. And by the time everyone sees it - the market will already be lower. I’ve spent 10 years studying markets, and I’ve called most major tops and bottoms along the way. And I’ll call it again in 2026. Follow me and turn notifications on before it’s too late. Don’t become the exit liquidity.

DANNY

142,432 görüntüleme • 1 ay önce

🚨 THE BIGGEST IPO IN HISTORY HAS ONE UGLY THING IN COMMON WITH EVERY MARKET TOP This is not a theory. It happened for 100 YEARS. Goldman Sachs in 1928. Intel in 1971. AT&T in 2000. Every one looked like the opportunity of a lifetime. Every one came near a major market top. Every one was followed by a brutal correction. Funny how the biggest “once-in-a-generation” IPOs always show up when the market is already overheated. Probably nothing. Now look at the real problem nobody wants to talk about: A $2 TRILLION listing needs buyers. Buyers need cash. But cash on the sidelines is already sitting near historic lows. So where does the money actually come from? It doesn’t appear out of nowhere. It comes from selling what funds already own. That means: • Big tech gets sold • Indexes get rebalanced • Liquidity gets drained • Retail becomes the exit JPMorgan estimates passive funds may need to dump around $95 BILLION of the biggest tech stocks just to make room for SpaceX. Read that again. $95 BILLION in forced selling. At the exact same time retail is rushing in to buy the hype. And smart money already started moving first. Hedge funds were dumping big tech before the IPO even opened. That is not a coincidence. That is liquidity leaving the room. Now let me be very clear: SpaceX is not a bad company. It might be one of the most important companies ever built. But the best company and the best trade are NOT the same thing. The market doesn’t care about the mission. It cares about: • Liquidity • Positioning • Forced buyers • Forced sellers • Math And the math looks almost identical to every major top of the last 100 years. SpaceX might not mark the exact top. But history is screaming that we are very close to one. Most people will celebrate. Smart money will exit. Retail will realize it too late. Keep in mind: I’ve called every major market top and bottom for over 10 YEARS. I was one of the only people who called the top in October, and I’ll do it again. That’s literally my job. If you still haven’t followed me, you’ll regret it.

DANNY

59,233 görüntüleme • 24 gün önce

After 1,000+ trades, this is the only setup that consistently works in any market condition. It's called liquidity sweep reversal—and it's the highest probability trading strategy I know. Before I show you what it is, here are the two things most traders get wrong with it: 1) They enter too early and get stopped out on the second sweep. 2) They try to predict the LAST sweep with certainty This is a sure-fire way to burn your money. Here's what to do instead: Step 1: Identify market control Look at structure. Higher highs and higher lows? Buyers are in control. We're only trading from demand zones. Step 2: Mark your liquidity zones Find equal lows. When retail sees a "double bottom," they go long because textbooks tell them to. Their stop losses sit right below those lows. Available liquidity for institutions to sweep. Step 3: Wait for the sweep Price drops, sweeps those stops, liquidates retail traders, then creates a sharp V-shaped reaction. This sweep breaks structure. Zoom into 1-hour timeframe - price was making lower highs and lows. After the sweep? Higher highs and higher lows. That sweep zone becomes your institutional demand zone. Step 4: Enter on mitigation Wait for price to pull back to the liquidity zone. Enter there. Stop below the zone. Target 2-3R. Remember: You'll NEVER predict with 100% certainty when it's the LAST liquidity sweep. Sometimes price sweeps 2-3 times before the real move. But that's trading—we trade probabilities, not certainties. Also, keep in mind: If you can't spot the liquidity, you ARE the liquidity. — This is just a breakdown of one of the trading strategies we covered in our 2-hour long cryptocurrency trading course. I also discussed the trend pullback strategy, how to trade breakout retests without getting stopped out on fake moves, and why understanding liquidity is the only way to avoid becoming exit liquidity. Just comment "COURSE" and I'll DM it to you immediately so you can watch it.

The Trading Geek (Brad Goh)

53,996 görüntüleme • 6 ay önce

📺 $TSLA HIT THE TARGET — TIME TO TAKE PROFITS? Please ❤️like and 🔁share with fellow Tesla traders/investors #Tesla closed Monday at $445.00, already reaching and slightly exceeding the key upside target of $442.26, which we had been anticipating for several weeks after bouncing from $347.63 long-term support. Price is now sitting right at a critical resistance zone: $442.26 → prior target, $444.99 → 5-week rising channel top. So, the key question now – is $TSLA just stretching into resistance (likely a pause/pullback)? Or has it broken through resistance (start of a new leg higher)? We are leaning toward “stretching” for now, not a confirmed breakout yet. For a true continuation higher, price behavior matters. We need a close above $444.99 (ideally two consecutive closes above this level). If this happens, the momentum “pull-away” effect kicks in, and short-term upside targets become: – $453.29 → next resistance (descending channel top) – $474.07 → major target (Nov high zone) If strength builds, $474.07 reachable mid this week (Wed–Thu). If #TSLA closes this week above $444.99, $498.83 (Dec high) is likely within 3–5 weeks, and $541.33 is possible within 2–3 months. This becomes a strong trend-continuation phase. * Today, if $TSLA opens above $444.99 → a quick move to $453.29 is possible. If it breaks above $453.29 → $474.07 becomes reachable even intraday. * Warning signals: – Failure to hold above $444.99 – Close back below $442.26 Stronger downside trigger: – Close below $415.83 → signals trend breakdown $387.07 becomes the downside target. This would shift the structure from trend continuation to a corrective pullback. * So, if already long, stay long, but watch key levels closely. If unsure, wait for a confirmation (close above $444.99). If you are not in yet, your entry becomes more attractive after a confirmed breakout, targeting the $500–$540 range. * So, $TSLA has completed its initial upside move and is now at a critical resistance zone. The market is deciding between: – Pause/consolidation (most likely near-term) – Aggressive breakout into a new bullish phase (if resistance breaks) Everything hinges on how the price behaves around $444.99 this week. * Watch the full Trading Plan for May 12, 2026 in this short video🔽

Wicked Stocks

20,630 görüntüleme • 2 ay önce

🚨 BITCOIN IS TOTALLY MANIPULATED, HERE’S THE PROOF Everyone is talking about how Bitcoin will make a new ATH. Everyone is posting charts… But almost nobody is looking at what’s actually happening. Stop staring at price. Look at the liquidity. This heatmap shows everything. Massive liquidation clusters sitting BELOW the current price. That’s where the real money is. So what happens? Insiders push price UP. Then: - Breakout traders jump in - Shorts get liquidated - Fake momentum builds And then suddenly… IT STOPS. Because that move was never meant to continue. It was designed to trap. Here’s what they’re doing: – Liquidity is stacked below – They force price higher – They pull in buyers – Then they reverse it Straight into the real target. The data is clear: – Repeated spikes into resistance – No continuation after breakout – Immediate rejection from highs – Liquidity below untouched This is how MARKET MAKERS MAKE REAL MONEY. And this is called insider manipulation. Push price up → build belief Trap longs → flip direction Then cascade → liquidations And where is the largest pool of liquidity right now? Below the current price. If you’re not watching heatmaps like this, you have no idea where price is going. For the record, I was the only one publicly calling the exact bottom at $16,000 three years ago and the top at $126,000 in October. If you missed those calls, don’t worry. I’ll call the next one too. Turn notifications on. If you’re not following yet, you’ll understand why that was a mistake later.

Alex Mason 👁△

610,321 görüntüleme • 3 ay önce

🚨 WARNING: THE NEXT 24 HOURS WILL CHANGE EVERYTHING!! The U.S. stock market is about to repeat history. S&P 500 is now mirroring the same pattern we saw during the dot-com bubble. The setup is IDENTICAL. If you hold any assets right now, you MUST know what’s coming next: Back in 2000, markets looked unstoppable. Momentum was strong. Confidence was high. And then everything broke. Billions were erased. Portfolios were crushed. And the dump was brutal. Right now, the chart is lining up almost point for point. Same breakout. Same overextension. Same false sense of security. And the warning signs are flashing. Valuations are stretched. Liquidity is tightening. Volatility is waking up. And risk is building underneath the surface. Most investors still don’t see it. Because at the top, everything feels normal. That’s how every major correction starts. Optimism peaks. Positioning gets crowded. And complacency takes over. Then the reversal begins. Fast. And once momentum flips, there is no gradual exit. There is only repricing. The market does not wait. It resets. And when it does, it moves violently. Right now, there are three paths ahead: 1⃣ SOFT RESET The market cools off. Valuations compress. Momentum stabilizes. 2⃣ DEEP CORRECTION Selling accelerates. Fear returns. Risk assets dump lower. 3⃣ FULL DOT-COM STYLE COLLAPSE Support breaks. Panic spreads. Liquidity disappears. Forced selling takes over. That is where real damage happens. Because when leverage unwinds, everything gets hit. Stocks. Crypto. Speculative assets. EVERYTHING. The chart is there. The setup is there. And history is staring investors in the face. Watch price action. Watch liquidity. Watch volatility. Because if this pattern completes, the next move will be impossible to ignore. And by the time everyone sees it - the market will already be lower. I’ve spent 10 years studying markets, and I’ve called most major tops and bottoms along the way. And I’ll call it again in 2026. Follow me and turn notifications on before it’s too late. Don’t become the exit liquidity.

0xNobler

224,239 görüntüleme • 2 ay önce

THE SILVER SELL-OFF IS BRUTAL – BUT DON’T MAKE THE MISTAKE OF SELLING TOO Silver just broke hard. Gold slipped under 4000. Silver crashed to 56. If you bought anywhere near the January high near 121, roughly half your position has vanished and it feels like the bottom may never arrive. But the number flashing on the screen is lying about what is actually happening. The sellers dumping metal right now are handing their ounces to buyers who see a sale, not a verdict. THE CORE THESIS Silver didn't get less valuable this week. The dollar got stronger. And that is a completely different thing. ➡️ The US dollar index just pushed above 101 for the first time in about a year. ➡️ When the dollar rips, every asset priced in dollars gets repriced lower almost automatically because it now takes fewer of those stronger dollars to buy the same ounce. ➡️ This is not the market rejecting silver. This is the measuring stick getting longer. ➡️ The Fed's new dot plot shows roughly half the committee projecting at least one rate hike this year, with traders pricing in as many as three quarter-point hikes before year end. THE DOUBLE HIT SILVER ALWAYS TAKES Silver wears two hats and both are getting slammed at the same time. ➡️ It is a monetary metal fighting the strong dollar. ➡️ It is also an industrial metal facing slower growth fears from higher rates. ➡️ That combination is exactly why silver falls roughly twice as hard as gold in moves like this. ➡️ The gold to silver ratio blows out because it is the nature of silver, not a flaw in silver. THE MECHANICAL SELLING DRIVING THE PAIN A lot of this selling is not anyone deciding silver is a bad investment. It is forced. ➡️ Margin requirements got jacked up. Leverage players had to dump their most liquid holdings to raise cash. ➡️ Stop losses tripped. ETFs rebalanced. The selling turned violent and mechanical. ➡️ This kind of forced selling eventually burns out when the sellers run out of metal they are willing to dump. ➡️ Conviction buyers do not run out of conviction. They are the ones quietly stepping in. THE PHYSICAL MARKET TELLS THE TRUTH The spot price is getting shoved around by macro forces and margin. The physical market is doing something very different underneath. ➡️ When metal gets crushed on the screen you would expect a flood of people dumping physical. That is not mostly what is walking in the door. ➡️ Yes, capitulation sellers who bought the top are handing over ounces. ➡️ But serious buyers are stepping in with both hands because to them a strong dollar selloff is a sale, not a verdict. "The weak hands are handing their ounces to the strong hands. That's what a bottoming process actually looks like." ➡️ Premiums on real coins and bars are holding firm and even rising. Demand is alive and well if you watch the all-in price instead of just spot. THE LONG-TERM MATH HAS NOT CHANGED The reasons you own silver in the first place are still sitting right there. ➡️ The debt has not gone anywhere. ➡️ Currency debasement over time has not gone anywhere. ➡️ Central banks are still net buyers. ➡️ The long-term destination remains 120 silver. This selloff does not erase the thesis. WHAT TO DO THIS WEEK ➡️ Do not sell into this panic unless you genuinely need the cash inside the next two years. ➡️ If you must raise cash, sell generic rounds and bars first. Protect your sovereign coins and anything inside your IRA. ➡️ For long-term buyers this is a sale, but watch the all-in price not just spot. Ladder your buys and keep dry powder. ➡️ Stress test how you hold your metal. If you have paper claims this is the week to move toward allocated segregated storage or take delivery. THE BOTTOM LINE The metal did not change this week. The dollar did. Don't let a strong dollar and a scary headline talk you out of the one asset they cannot print. Before you hit that button ask yourself one honest question. Do I actually need this money in the next 24 months? If the answer is no, you are not escaping a collapse. You are selling your insurance in the middle of the storm to the very people who will be happy to sell it back to you later at a much higher price. HT: YouTube Summit Metals #SilverSelloff #DontSellSilver #DollarStrength #PhysicalSilver #Stacking #PreciousMetals #SilverStacker

Mark

32,014 görüntüleme • 18 gün önce

Everyone feels safe again. That’s usually when the market does the most damage. Bulls are comfortable up here. Too comfortable. New highs, shallow pullbacks, constant dip buying and endless optimism. The same mindset shows up every cycle right before things change. Hope creeps back in. Risk gets ignored. Complacency takes over. This is how they lure people in. The market rarely tops in fear. It tops in confidence. It tops when people are convinced nothing bad can happen anymore. When every dip is “free money.” When bad news is shrugged off and good news is celebrated twice as hard. And while that’s happening, the weekly signals are doing something very different. My weekly signal line has been warning that this move gets sold. Not chopped. Not paused. Sold. The kind of selling that doesn’t give you time to react. The kind that doesn’t let you “reposition.” The kind that turns staircases up into elevators down. That’s how this works. Markets grind higher slowly, painfully, lulling everyone into patience. Then when the turn finally comes, it’s fast. Violent. Emotional. Weeks of gains erased in days. Everyone remembers the staircase. Very few are prepared for the elevator. This isn’t about predicting the exact candle. It never is. It’s about recognizing the phase of the cycle we’re in. And this phase is marked by complacency, stretched positioning and signals that are rolling over while price still looks “fine.” That disconnect is where damage is done. I’ve been saying it consistently. Short term bounces don’t change larger signals. They create opportunity. Opportunity to manage risk. Opportunity to build positioning. Opportunity to stay patient while others get pulled back into hope. The video attached breaks this down in detail. The signals, the psychology and how I’m navigating it without getting emotional on every green or red candle. You don’t have to agree with me. Most people won’t until price forces them to. But when the staircase finally gives way to the elevator, this phase will make a lot more sense in hindsight. Thank you for your attention to this matter. — TJ #SP500 #SPY #QQQ #TSLA #PLTR #NVDA #AAPL #Bitcoin #Crypto #StockMarket #MoveTo600

TraderJonesy

42,146 görüntüleme • 5 ay önce