Loading video...
Video Failed to Load
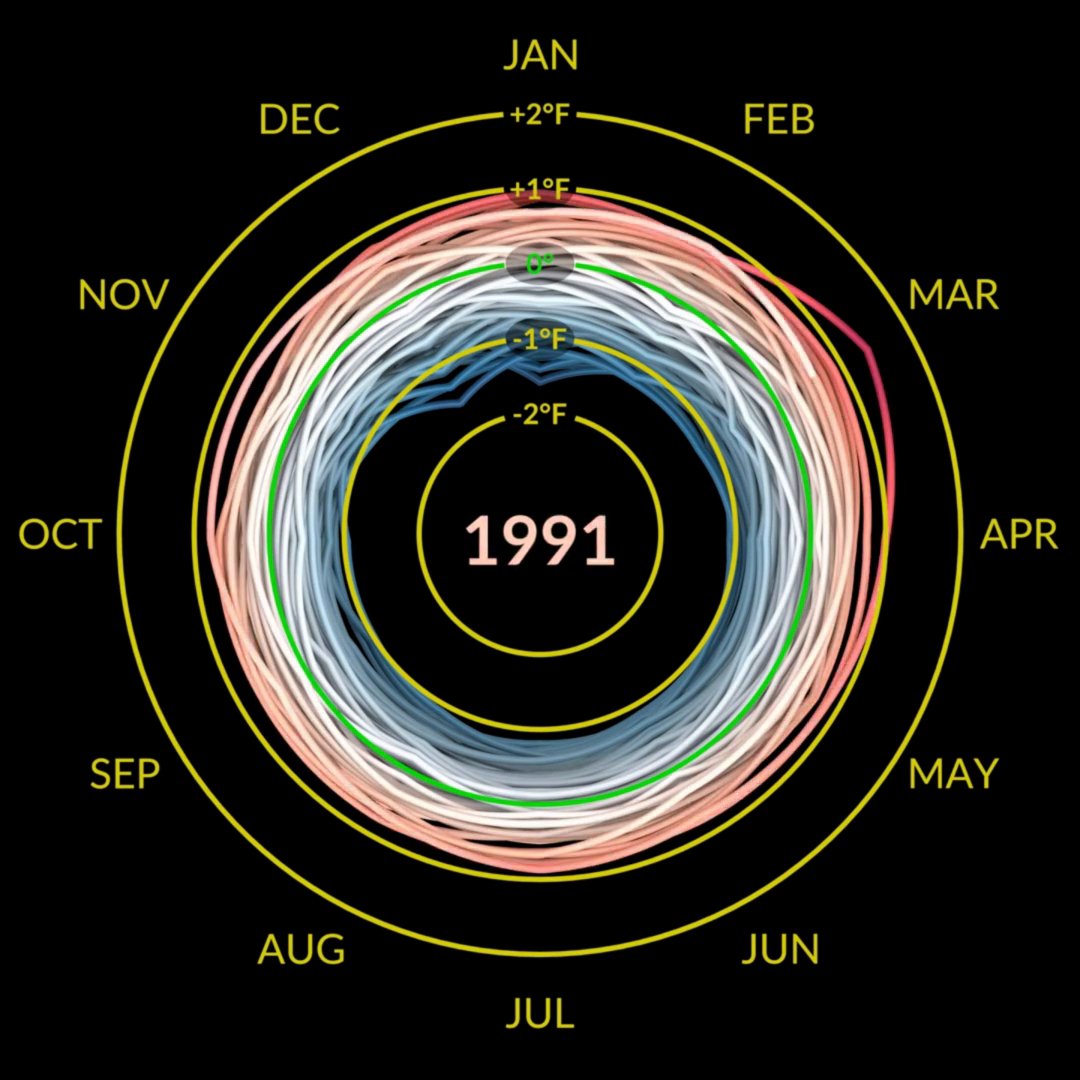
startling nasa visualization of climate anomalies from 1880-2022

231,450 views • 3 years ago •via X (Twitter)
8 Comments

Rohan3 years ago
This is an ingenious visualization, wow.

D’Shaun Maddeauxn X3 years ago
when it’s a big enough of a problem, we will adopt widescale nuclear energy. Otherwise, it’s noise

Motirolla3 years ago
1 degree in 140 years, run to the hills.

Charles Morgan3 years ago
Looks cool. Just for comparison, can you show the 100 years before that? Would be nice to see how much cooler the climate was back then.

Kate Johnson3 years ago
Can you please share a link to the data source and methodology behind this visualization? Thanks.

Bruce Lund3 years ago
NASA had much better satellites after 1920.

Sam Doré Hall3 years ago
This is a good thing right? Right?!?

allavut3 years ago
Private jets should be outlawed.