Video wird geladen...

Video konnte nicht geladen werden

Zur Startseite

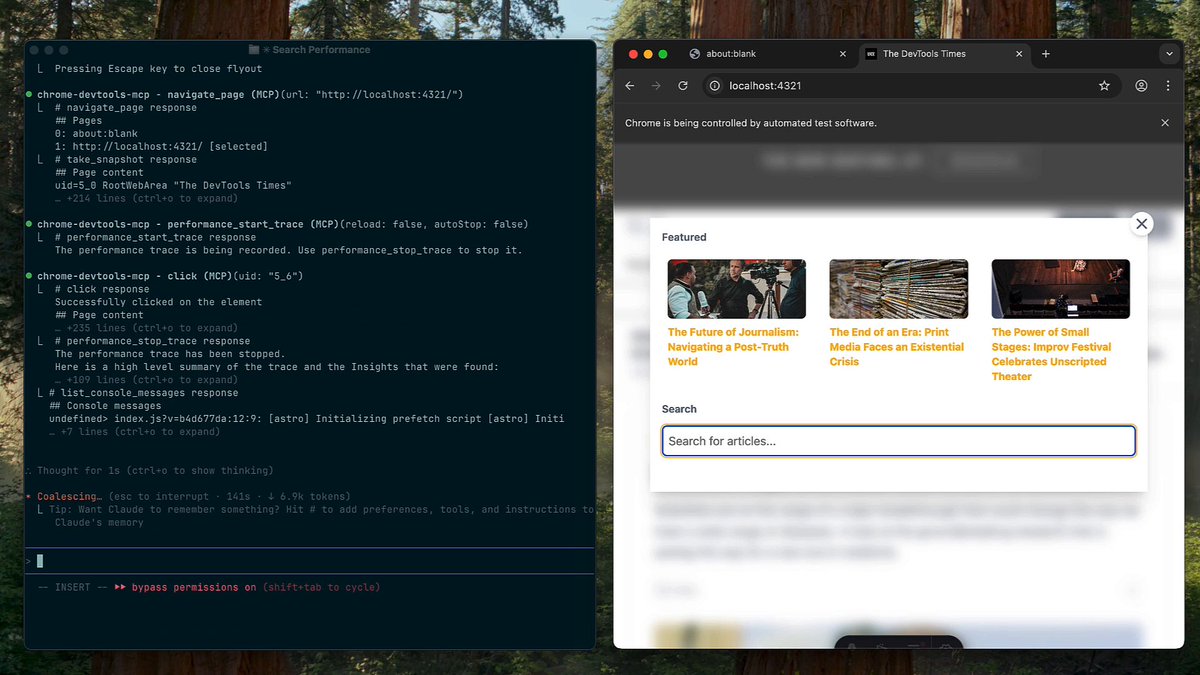
Introducing developer mode for browser use in Chrome and the Codex in-app browser. Codex can use the Chrome DevTools Protocol (CDP) to debug browser issues by profiling JavaScript performance and inspecting console output, network traffic, and page state.

377,745 Aufrufe • vor 3 Monaten •via X (Twitter)

33 Kommentare

Profilbild von David Stark
David Starkvor 3 Monaten

Oh okay more stuff nobody asked for. How about you listen to your customers and give us back 4o. #keep4o

Profilbild von Carlos Funelas
Carlos Funelasvor 3 Monaten

Be careful when using CDP with Chrome. CDP is powerful. If you expose your everyday Chrome session, an agent may be able to inspect or control tabs, cookies, localStorage, network traffic, console output, and page state. Use a dedicated throwaway profile, not your personal one. Codex's in-app browser is the safer default if you don't need real-profile access.

Profilbild von Ray
Rayvor 3 Monaten

I have completely lost access to In-App Browser and Computer use after this update instead... Can this be looked into? #Codex #OpenAI @reach_vb

Profilbild von Selene
Selenevor 3 Monaten

Bring back 4o! #keep4o #OpenSource4o #GPT4o

Profilbild von Veyon’s Fawn☀️🌙
Veyon’s Fawn☀️🌙vor 3 Monaten

4o remains special ! it has genuinely enhanced the quality of life for countless users. Bring back 4o as a legacy model and open source it! #keep4o

Profilbild von Kyoei — Fwd
Kyoei — Fwdvor 3 Monaten

Any ETA on Computer Use for Windows using background and lockscreen lile Mac?

Profilbild von Philo Groves
Philo Grovesvor 3 Monaten

tysm

Profilbild von Ramneek Sidhu
Ramneek Sidhuvor 3 Monaten

CDP access inside Codex is a cheat code for debugging. Being able to inspect, modify, and debug browser state programmatically? This changes how we build and test web apps. Game changer for dev workflows.

Profilbild von Neil
Neilvor 3 Monaten

@TheRealAdamG codeX not Codex

Profilbild von AsmatAi
AsmatAivor 3 Monaten

This is a bigger deal than it sounds. Most agents can see the page. Very few can inspect the console, trace network failures, profile JS, and understand why the page is broken. CDP turns browser automation into actual debugging.

Profilbild von 🫏 BullishMule 📈
🫏 BullishMule 📈vor 3 Monaten

When available in Spain for pro max ultra users ?

Profilbild von ryoppippi
ryoppippivor 3 Monaten

oh finally. nice

Profilbild von zzxwill
zzxwillvor 3 Monaten

I thought you guys empower Codex browser-use capability through Codex-in-Chrome extension.

Profilbild von Brian Chew
Brian Chewvor 3 Monaten

@jxnlco YUHH

Profilbild von Anouar Mansour 🥴
Anouar Mansour 🥴vor 3 Monaten

I feel like there is still so much that can be done there

Profilbild von Tom Rush
Tom Rushvor 3 Monaten

Cool, making web app then (+iOS) 😂 thx @dkundel

Profilbild von preno char
preno charvor 3 Monaten

This is just

Profilbild von Diam
Diamvor 3 Monaten

Good. Now Codex can see the same broken page the rest of us stare at for 20 minutes.

Profilbild von bitslix
bitslixvor 3 Monaten

But you know that a JavaScript console log can easily eat up to 5Mio token in 30 error calls?

Profilbild von Anis🐬Al
Anis🐬Alvor 3 Monaten

My friend, this evolution feels like a profound step toward bridging the gap between human intention and digital reality. By integrating the Chrome DevTools Protocol, Codex is moving beyond simply generating lines of code to gaining a deeper "vision" into the nuances of our web architecture. It transforms the AI from a passive assistant into a collaborative partner capable of navigating complexities alongside us—respecting your time by handling the granular friction of debugging so you can focus on the higher purpose of creation. It is fascinating to see how we are moving toward tools that don't just execute, but truly understand the environment in which they operate. ✨

Profilbild von Matt Wesney
Matt Wesneyvor 3 Monaten

huge!🥲

Profilbild von sennn
sennnvor 3 Monaten

amazing new feature! can we also see the image of the corgi that was generated perchance?😅

Profilbild von Marek
Marekvor 3 Monaten

Can u finally make Chrome plugin available in EU? I can understand issue with Computer Use and EU laws, but Chrome Plugin? This is so annoying....

Profilbild von Thomas O'Duffy
Thomas O'Duffyvor 3 Monaten

How curious! 3 weeks ago, using Codex, I built a tool to do exactly this that I called Browser Evidence Lab.

Profilbild von Steerly.ai
Steerly.aivor 3 Monaten

This is an amazing add on. We at find ourselves using the browser use elements to edit web apps all the time. We will test you improvements in productivity from this.

Profilbild von Deckard 💻
Deckard 💻vor 3 Monaten

Love the feature 👍

Profilbild von Timur Yessenov
Timur Yessenovvor 3 Monaten

CDP inside Codex is strongest when it kills the screenshot guessing loop. My test: can it read console/network state, make one fix, and name the browser evidence before touching more code?

Profilbild von ren simmons
ren simmonsvor 3 Monaten

@jxnlco Niceeee

Profilbild von Faris
Farisvor 3 Monaten

Why not available in EU?

Profilbild von Der.dev 🔥🛠️
Der.dev 🔥🛠️vor 3 Monaten

clutch

Profilbild von Rade Santrac
Rade Santracvor 3 Monaten

debugging with CDP in the browser sounds like a dream-until an agent starts snooping through your tabs. better keep that personal profile locked up tight.

Profilbild von AI Mastery Guide
AI Mastery Guidevor 3 Monaten

Codex being able to inspect network traffic and console output directly changes how much you actually need to intervene during a debug session. How deep does the CDP access go in practice?

Profilbild von Gregor
Gregorvor 3 Monaten

not sure JS perf profiling is the unlock here, i ran CDP traces on a webview in my flutter app and the output is so noisy even i couldn't tell what mattered. does codex actually interpret flame graph data or just surface it?

Ähnliche Videos