
Eric Betzig
@Eric_Betzig • 3,632 subscribers
An engineering physicist sometimes masquerading as a biologist or, on one occasion, a chemist. Aspiring astronaut. Nuclear is the way.
Shorts


Videos

Reductionism has been a powerful force for understanding fundamental aspects of complex systems, but its very success has blinded most biologists to its crippling inability to make sense of complex emergent dynamic systems. We have the tools now to noninvasively observe and perturb living cells in their stunning holistic complexity, but the tyranny of reductionism has reserved the most important tool of all, AI, to approaches (e.g., structural biology, genomics, and spatial transcriptomics) ill-suited to their practitioners stated goal of building "virtual cells". It's been very frustrating convincing the gatekeepers of large HPC clusters otherwise.
Eric Betzig51,720 views • 1 month ago


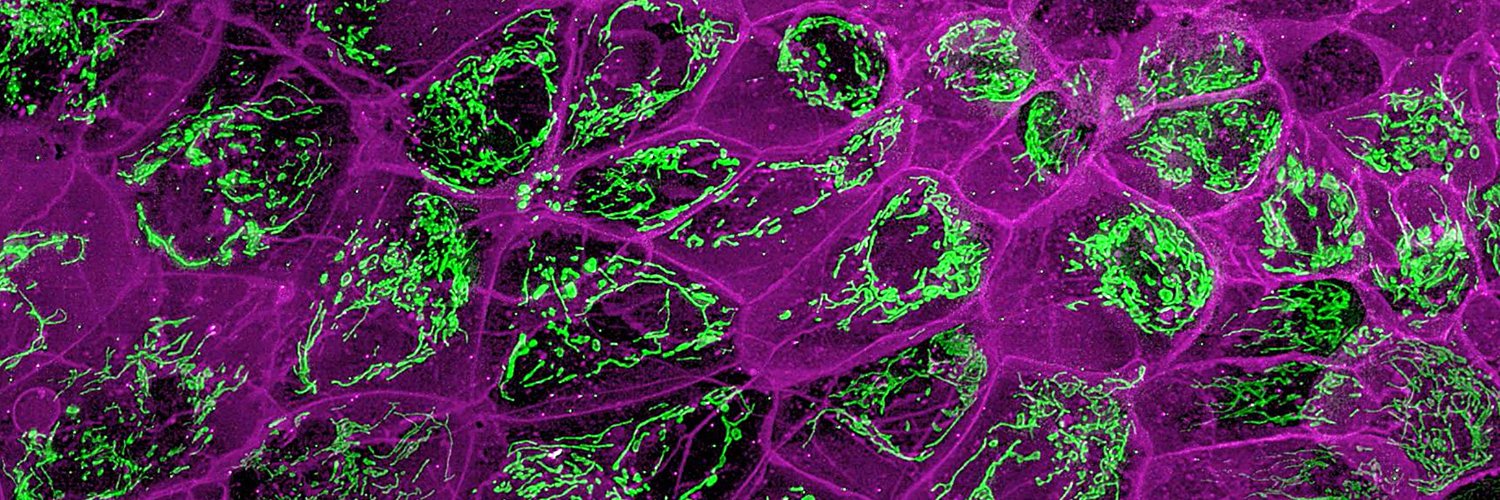
#FluorescenceFriday #cellbiology #bioart The interior of the cell is a busy place, as seen by grazing incidence structured illumination microscopy at 30 frames per minute: Lysosomes (green) can become corralled by the endoplasmic reticulum (ER, magenta), but can also remodel the ER when they are actively transported at high speed along microtubules (MTs, yellow). ER tubules are also remodeled directly when they associate with the growing or shrinking ends of MTs.
Eric Betzig41,985 views • 2 years ago


At #ASCB2024 today to speak in the session "Accelerating Discoveries in Cell Biology Using AI" about our Cell Observatory initiative to expand our understanding of subcellular physiology in the native multicellular environment by coupling advanced 4D imaging with AI. We're hiring, so if you're interested in an alternative to the traditional academic path and want to become part of a hard working interdisciplinary team taking on a crazy hard but potential transformative scientific challenge, join me in Room 30C at 3:15 PM.
Eric Betzig25,556 views • 1 year ago


#FluorescenceFriday #zebrafish #bioart To see cells as they really are, it's necessary to see them in the native multicellular environment in which they evolved. However, the deeper we peer into living tissue, the more our view is obscured by optical aberrations. Here, take a trip as we dive 200 um down from the optic tectum to the hindbrain in a living zebrafish, turning on adaptive optics to correct these aberrations as we go, to see oligodendrocytes (orange) and neural nuclei (green).
Eric Betzig26,336 views • 2 years ago


#FluorescenceFriday #neuroscience #bioart A minute sliver of some of the most complex matter in the known universe: a small subset of neurons (yellow) and pre- (blue) and post- (magenta) synaptic markers over 75 x 100 x 125 um in layers IV-V of the mouse primary somatosensory cortex, as seen by combined expansion and lattice light sheet microscopy (ExLLSM): The first six seconds show all pre/post synaptic pairs, the remainder shows only those pairs associated with the small subset of labeled dendritic spines. An insanely complicated computational machine.
Eric Betzig17,476 views • 2 years ago


#FluorescenceFriday #Science #neuroscience Dendritic branches (green) in the mouse brain, studded with spines ("lollipops"), and myelin sheaths (pink tubes) that surround axons. Contacts between axons and dendrites called synapses facilitate communication between neurons. There are ~100 trillion synapses in the human brain, so collectively humanity has the same order of synapses as the 10^24 stars estimated in the observable universe. As seen by lattice light sheet expansion microscopy.
Eric Betzig16,375 views • 2 years ago


#FluorescenceFriday #neuroscience #neurodevelopment Axonal wiring of newly differentiated neurons stochastically labeled by Autobow in the spinal cord of a zebrafish embryo, 48-60 hours post fertilization, as seen by adaptive optical lattice light sheet microscopy
Eric Betzig13,075 views • 2 years ago